Agile Work Management
2 mins read
This section provides the functional aspects of Agile Work Management as part of this release.
Enhanced Risk Planning and Ownership
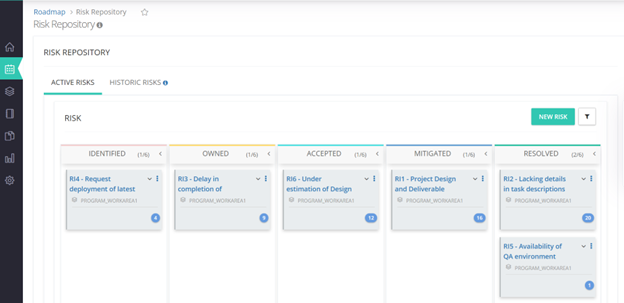
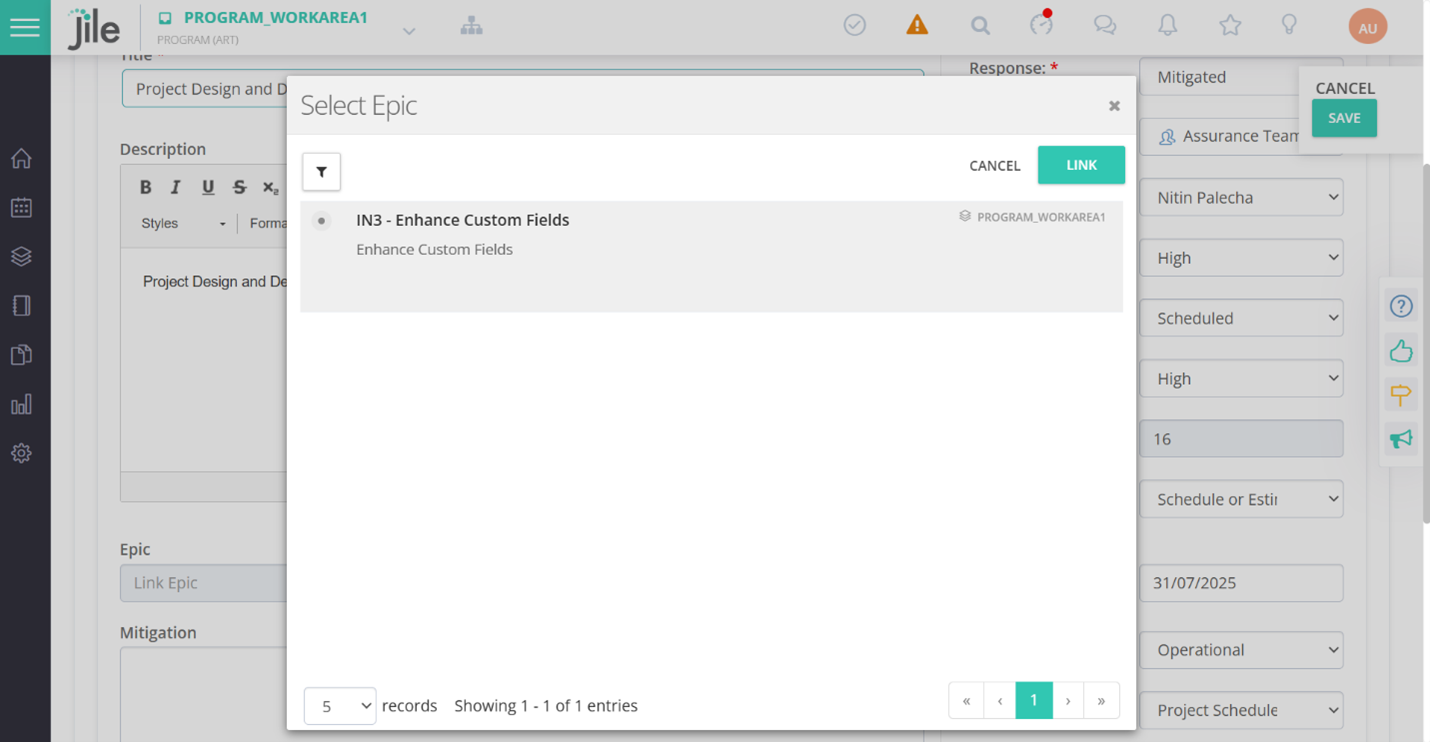
The all-new risk repository function with enhanced permissions setting, cloning feature, and linkage to other entities helps manage risks better.
Here's What is New
- Documenting risks and responses in a repository.
- Identifying risks and creating an appropriate response plan Resolve, Own, Accept or Mitigate.
- Filtering and focusing on risks based on various attributes such as impact, owner, and response category.
- Initiating contextual discussions with teammates around the identified risks to create a response.
- Attaching additional artifacts that can provide more insights right under risks for easy and quick access.
What Makes This Update Useful
- Documenting risks and responses in a repository.
- Define risks at a program level so that a Risk Repository can be maintained at the program level.
- Clone, import and export functionality to save time.
- Configure permissions with workspace admin to help control access to the risks.
More Power to the Centralized Review Teams
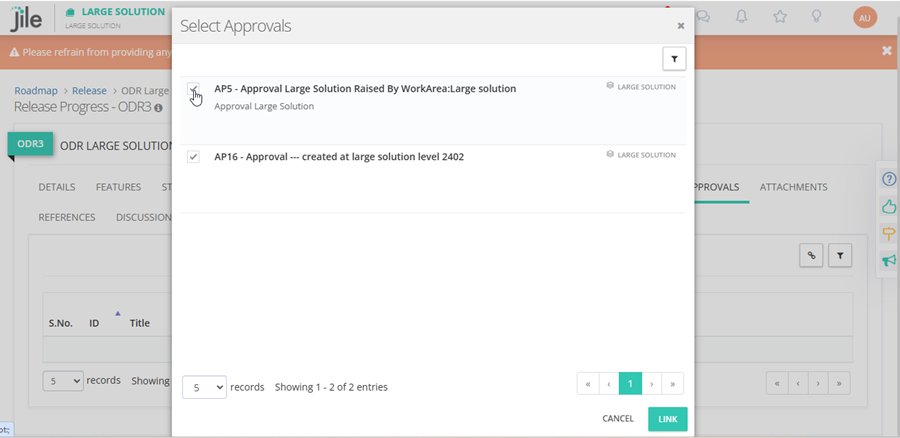
Loaded with enhancements, this feature allows you to stay on top of the Approval Requests.
Here's What is New
Uploading attachments against Approval Requests
Initiating contextual discussions against a Request.
Tagging Approval Request(s) to a Release.
Workspace Admin will be able to define custom fields for Requests.
Workspace Admin will be able to set permissions for Requests.
Gantt - Timeline Chart to Show Feature or Story Title as First Column Instead of ID
Provides details of how the Timeline Chart is set to show the first column.
Here's What is New
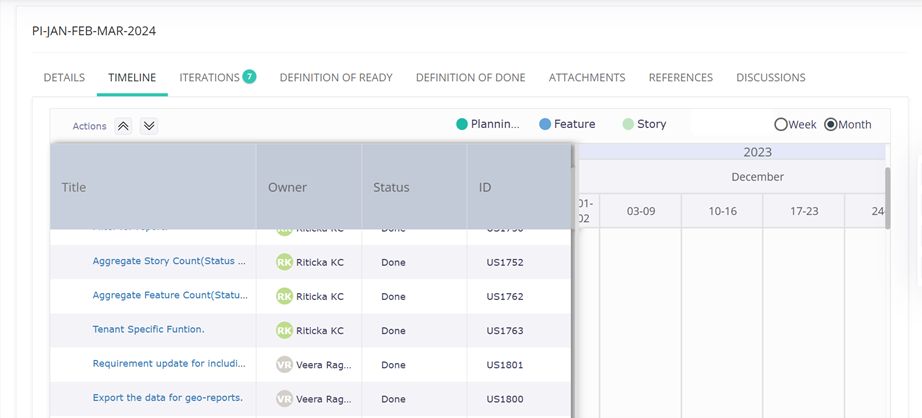
- The title of a feature or story will appear as the first column instead of ID as the title carries more meaningful information.
- The 'Timeline View' will be as follows:
- Title - should be frozen
- Owner
- Status
Test Management Got Better with These Important Features
2 mins read
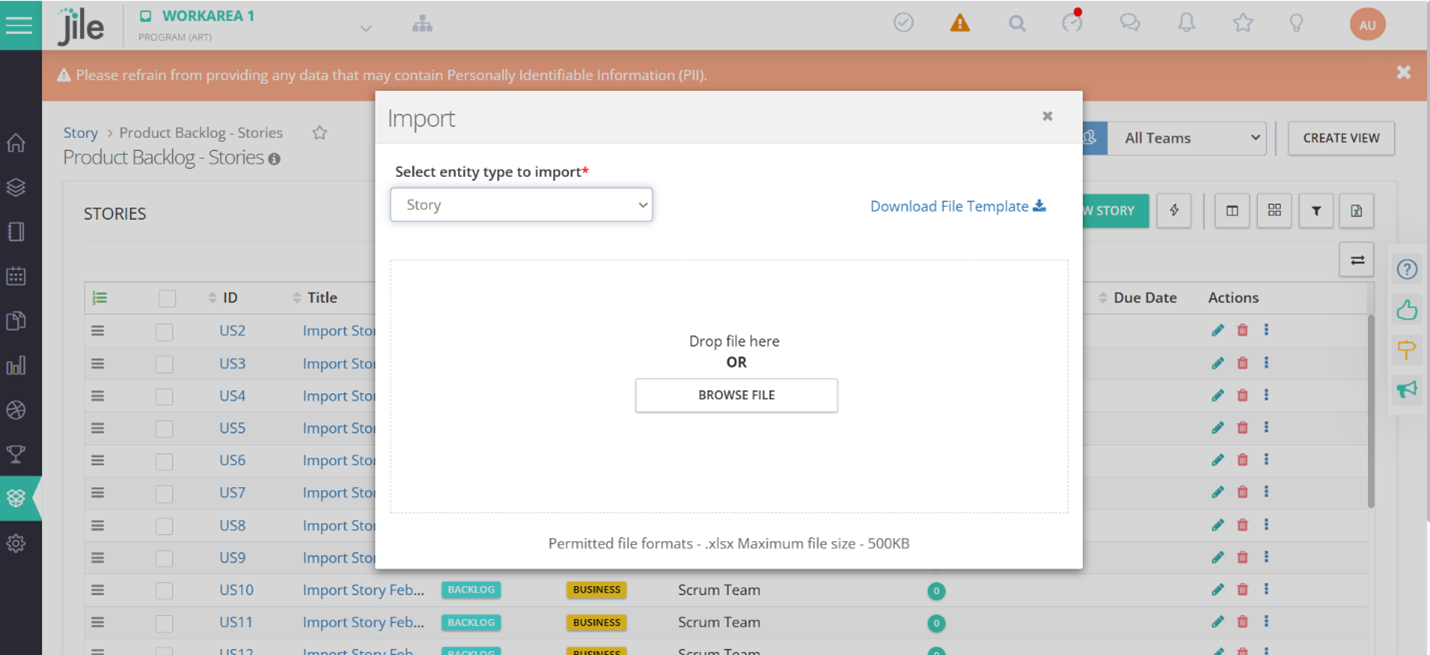
Unified Import Manager to Track All Jobs in One Place
Import backlog stories with Pause, Resume, and Restart option for jobs and track all entities in a single view.
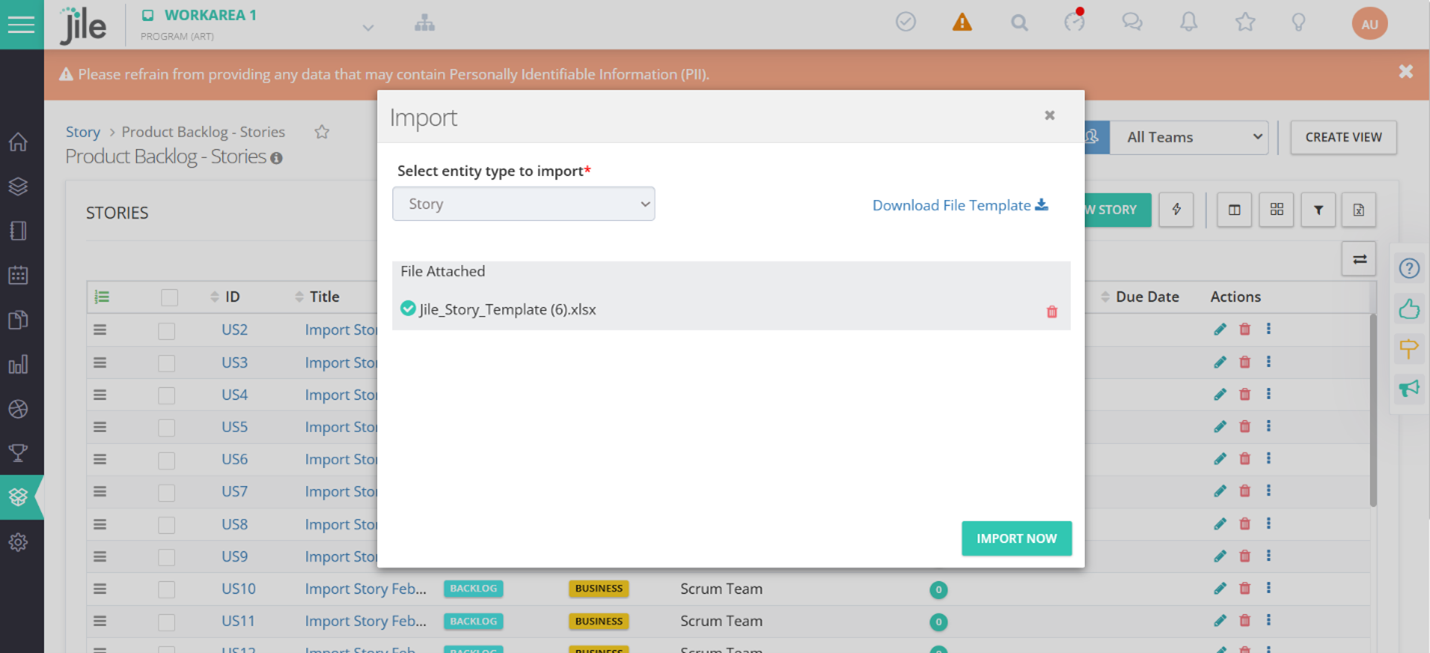
Here's What is New
- Centrally view all entity imports in one place.
- Use Spring Batch to import run async in the background, ensuring smoother performance and better load handling.
- Pause, resume, and restart jobs based on the need.
What Makes This Update Useful
- Gives clear visibility and control over import activity from a single location.
- Prepares the platform to handle different types of entity imports under one unified experience.
Here's What You Should Stay Tuned For
Multiple entities such as tests, defects will be added in a single instance with upcoming updates.
Custom Fields in Test Suites
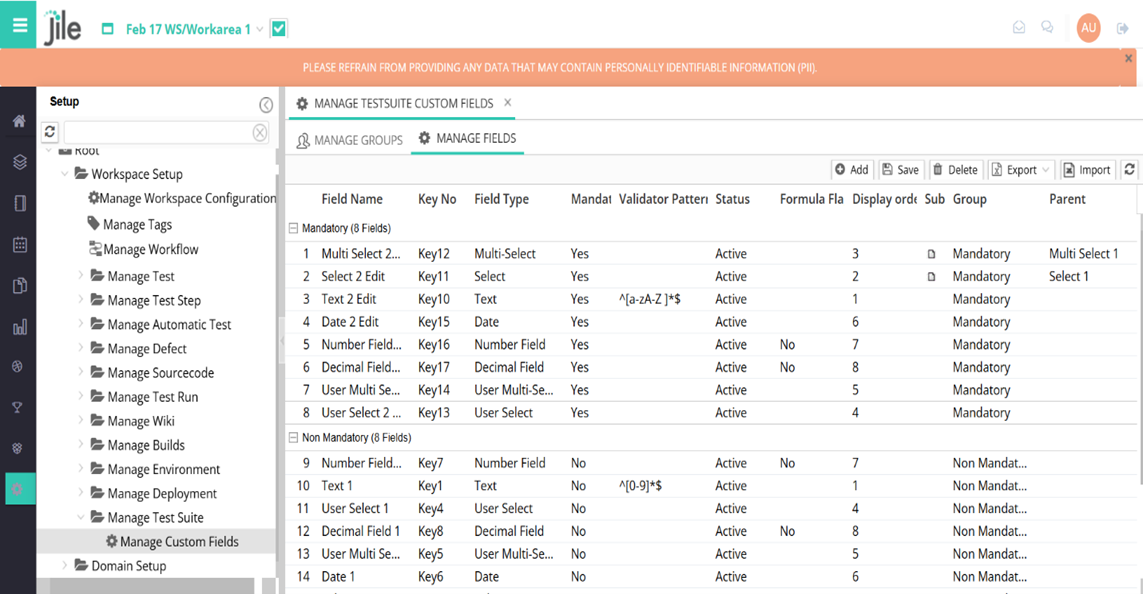
Now create, edit, export, import, and delete custom fields specific to your project, with ease.
Here's What is New
- Add custom field(s) in a Test Suite from the 'Manage Test suite, section under 'Setup'.
- Create a new Test Suite from the Test Execution module where you will get an option to enter configured Custom Fields.
- Create new Test Suite by entering values in these custom fields. Update the Test Suite Custom Field values.
What Makes This Update Useful
- Capture all information related to the test suite in one place.
This makes test planning more flexible with improved clarity.
- While creating or editing a test suite, fill in values for these custom fields under a new Additional Details'tab.
- The system also supports actions such as copying, updating, and deleting test suites that include these custom fields.
AI-Powered Journey of User Stories - Generation, Qualification, and Testing
2 mins read
The following features in Gen AI provide details of what is new and the benefits.
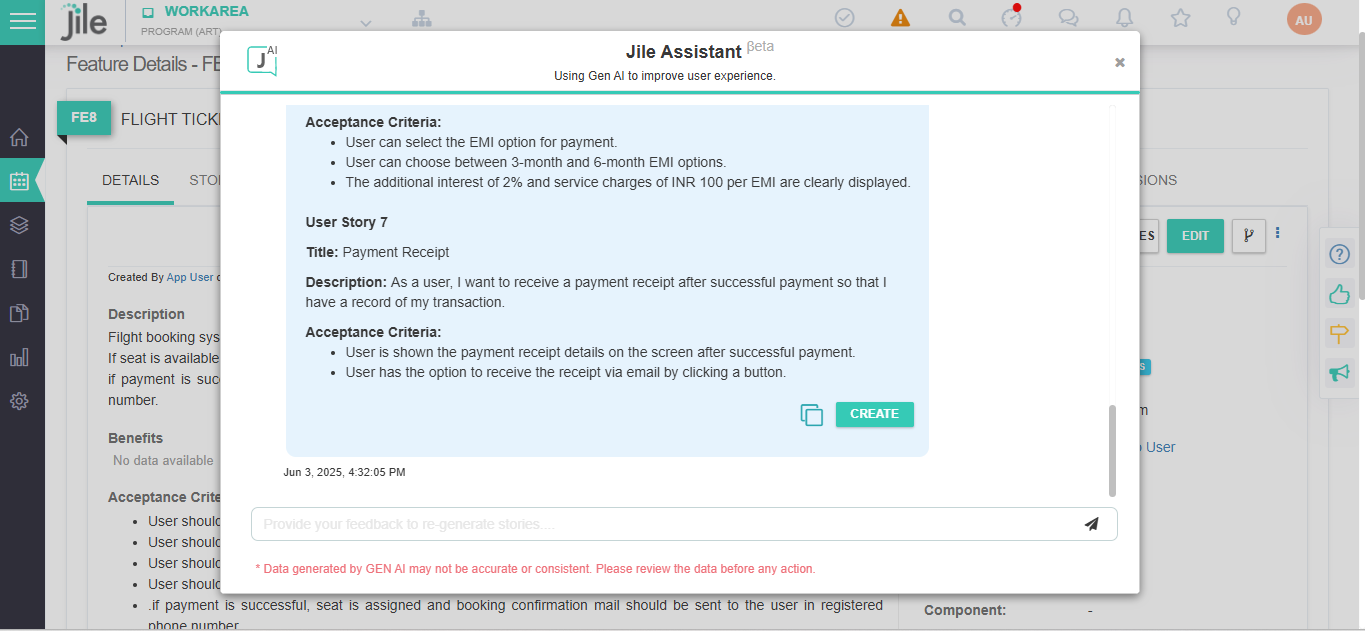
Generating User Stories from Features Using Jile AI Assist
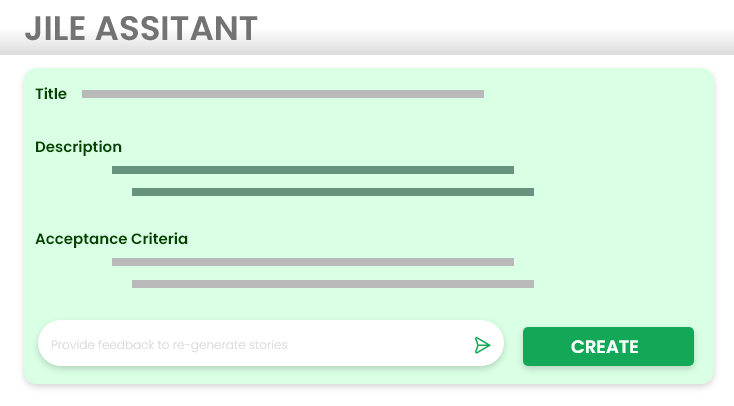
Convert descriptive feature requirements from different sources into precise user stories with Gen AI.
Here's What is New
- Visit the feature description page and request the Jile AI assist to detail out any feature into various stories.
- Detail out stories based on the data available and present them using AI Engine (configured for the product). These stories are expected to have basic attributes such as summary, description and acceptance criteria.
- Based on the presented stories, generate all stories at once in the system.
Any other required fields will be configured with default values.
- Review these stories later and change their status to 'Ready'.
- Alternatively, review and edit the text as required and then create stories individually.
Based on configuration, feedback can then be sent to AI engine.
What Makes This UAIPower-Generatingpdate Useful
Jile AI Assist helps streamline planning and enables teams to move from feature conception to actionable stories with precision and agility.
- Input analysis: Parses feature descriptions using TCS parses to extract user roles, goals and acceptance criteria.
- AI powered story generation: Uses fine-tuned prompt for GenAI to produce thorough, structured user stories in the format.
- Validation and refinement: Aligns stories to feature objectives and allows iterative feedback driven refinement.
- Compliance assurance: Vets generated data through TCS Guardrail to ensure compliance with ethical and business standards.
Qualifying User Stories Using AI Assist
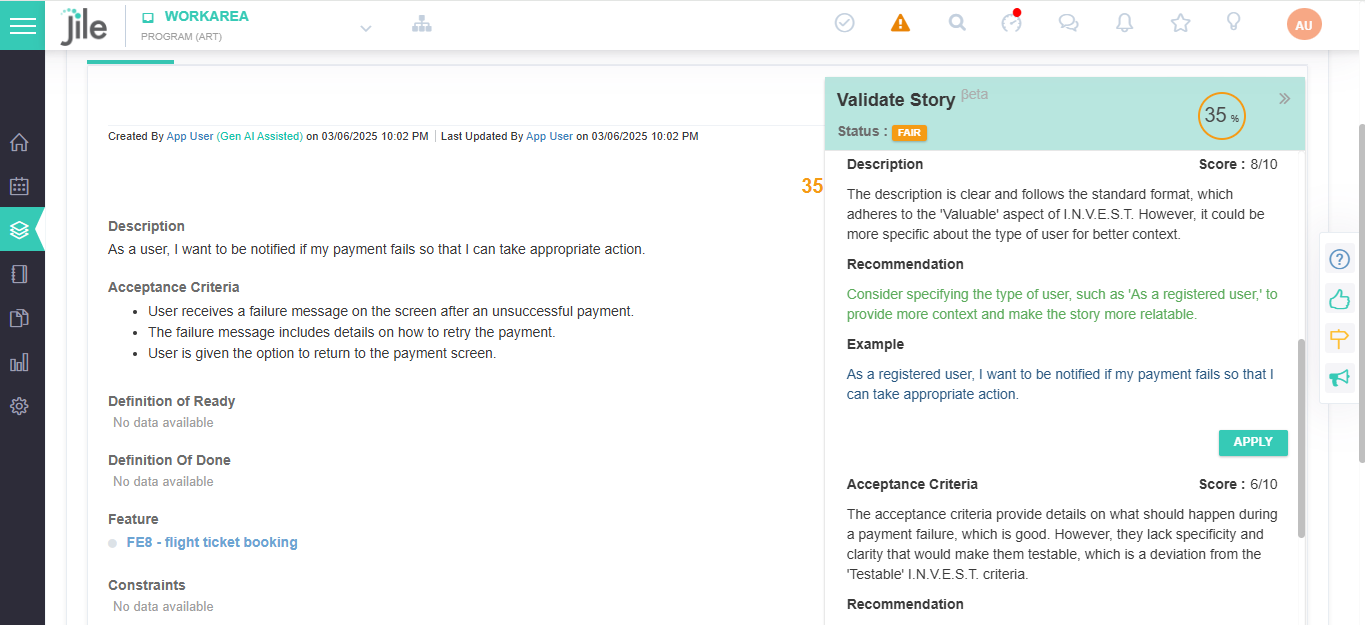
Assess and qualify user stories using Agile Invest Principle powered by Jile AI Assist and gain complete clarity before estimation and planning.
Here's What is New
- Jile AI Assist Enhancement offers suggestions for improving user stories.
- Access it on your story description page.Start by requesting Jile AI assist to suggest areas of improvement based on certain industry benchmarks defined. Accordingly, it will suggest the gaps that can help the Engineering or QA team with understanding, estimating, and improving the quality of user stories.
What Makes This Update Useful
- Ensure that teams start with high-quality inputs, accelerating delivery and improving cross-functional alignment using the User Story Improvement Suggestion.
- It ensures that your project documentation is clear, consistent, and ready for development, thereby reducing delays and improving project execution.
Generating Test Cases for User Stories using AI Assist
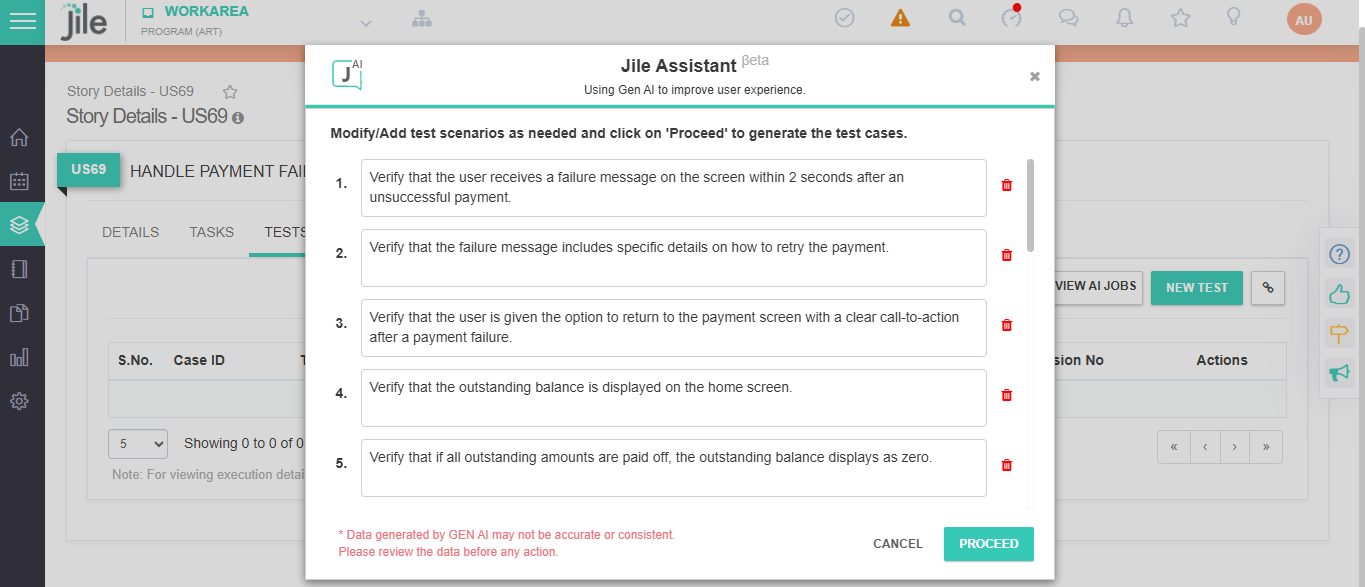
The QA and Development teams can now generate manual test cases for user stories using AI and get that perfect head start.
Here's What is New
- AI-assisted test case generation takes efficiency and coverage to a whole new level. It also seamlessly integrates with Jile for better test case management. This amazing new feature also allows you to generate Test Automation Scripts and Test Data, making your testing framework more robust.
What Makes This Update Useful
- Increase efficiency: Accelerates test case creation by automating manual steps.
- Improved coverage: Identifies edge cases and boundary conditions that are often missed manually.
- Consistent quality: Maintains uniformity and test case structure across stories.
- Continuous learning: Enhances AI outputs through tester feedback.
- Seamless integration: Fits naturally into the existing Jile workflows without disrupting tools or processes.
Note :
Contact Sales for more details about the availability of this feature.
A Power-packed Insights Framework with Numerous Outstanding Features for Better Visualization
2 mins read
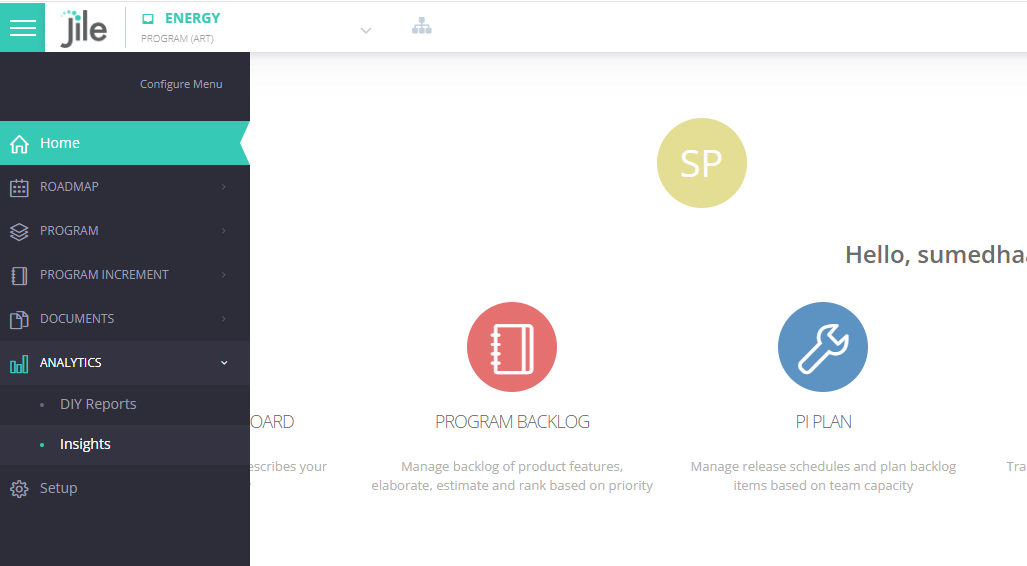
The following features in Gen AI provide details of various visualizations that offer data analysis capabilities.
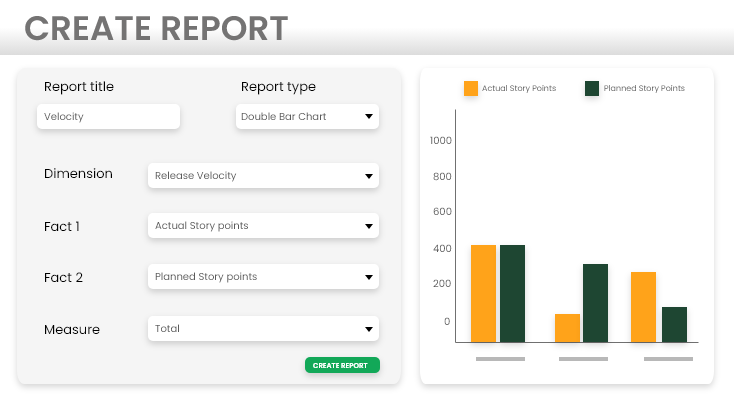
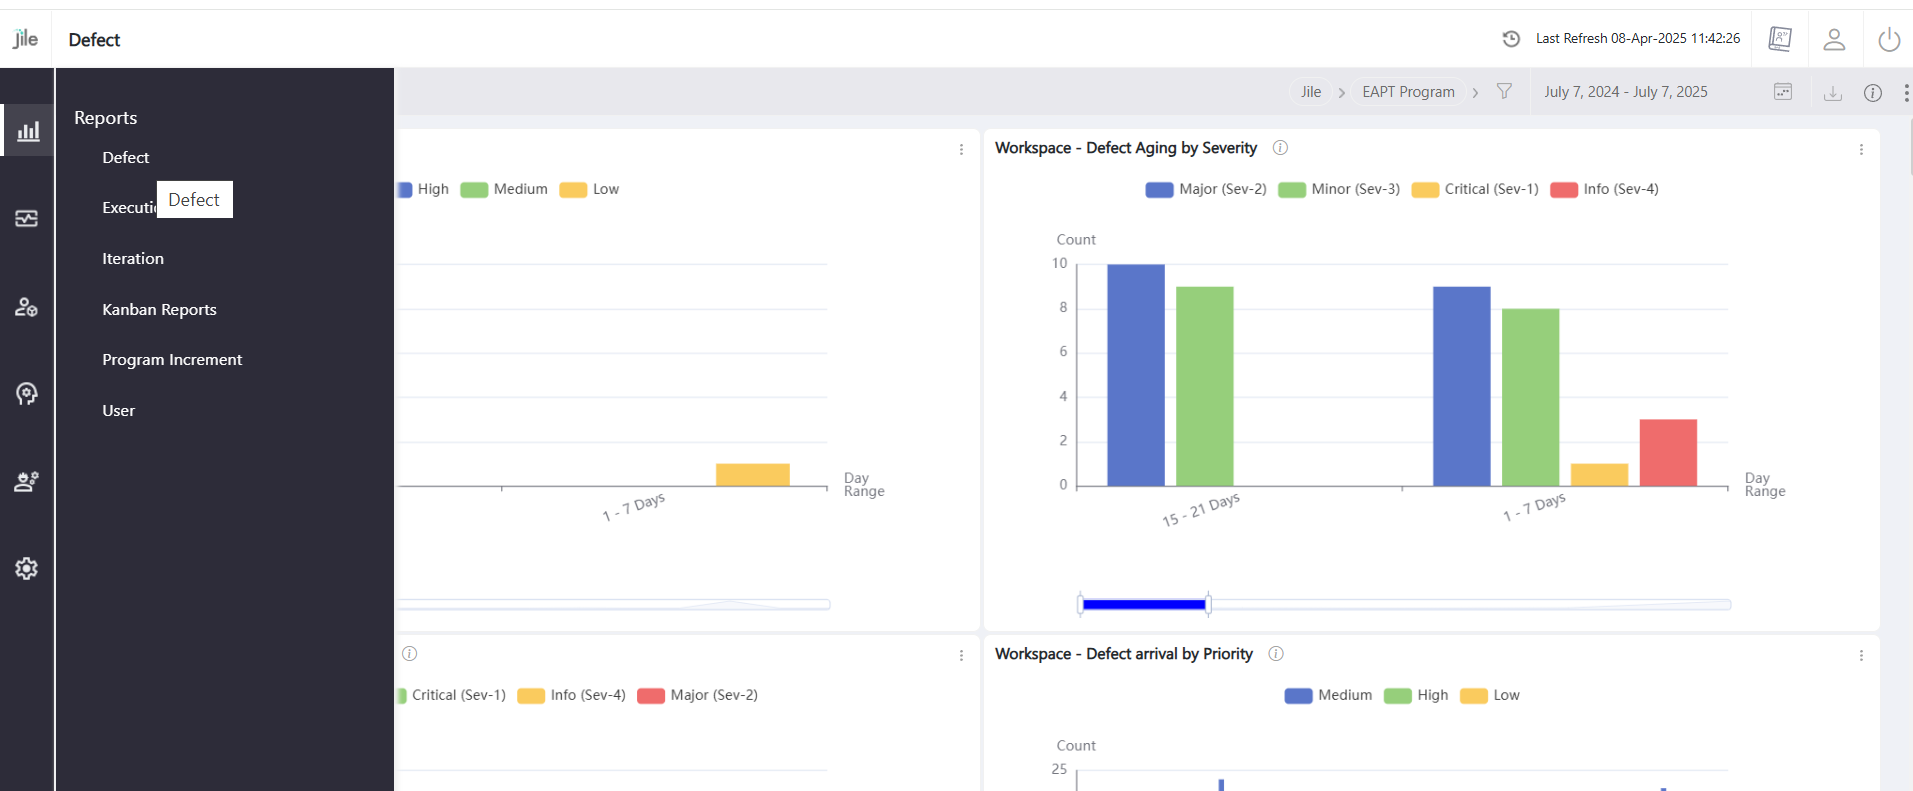
DIY Enhancement - Report Generation from Data Marts
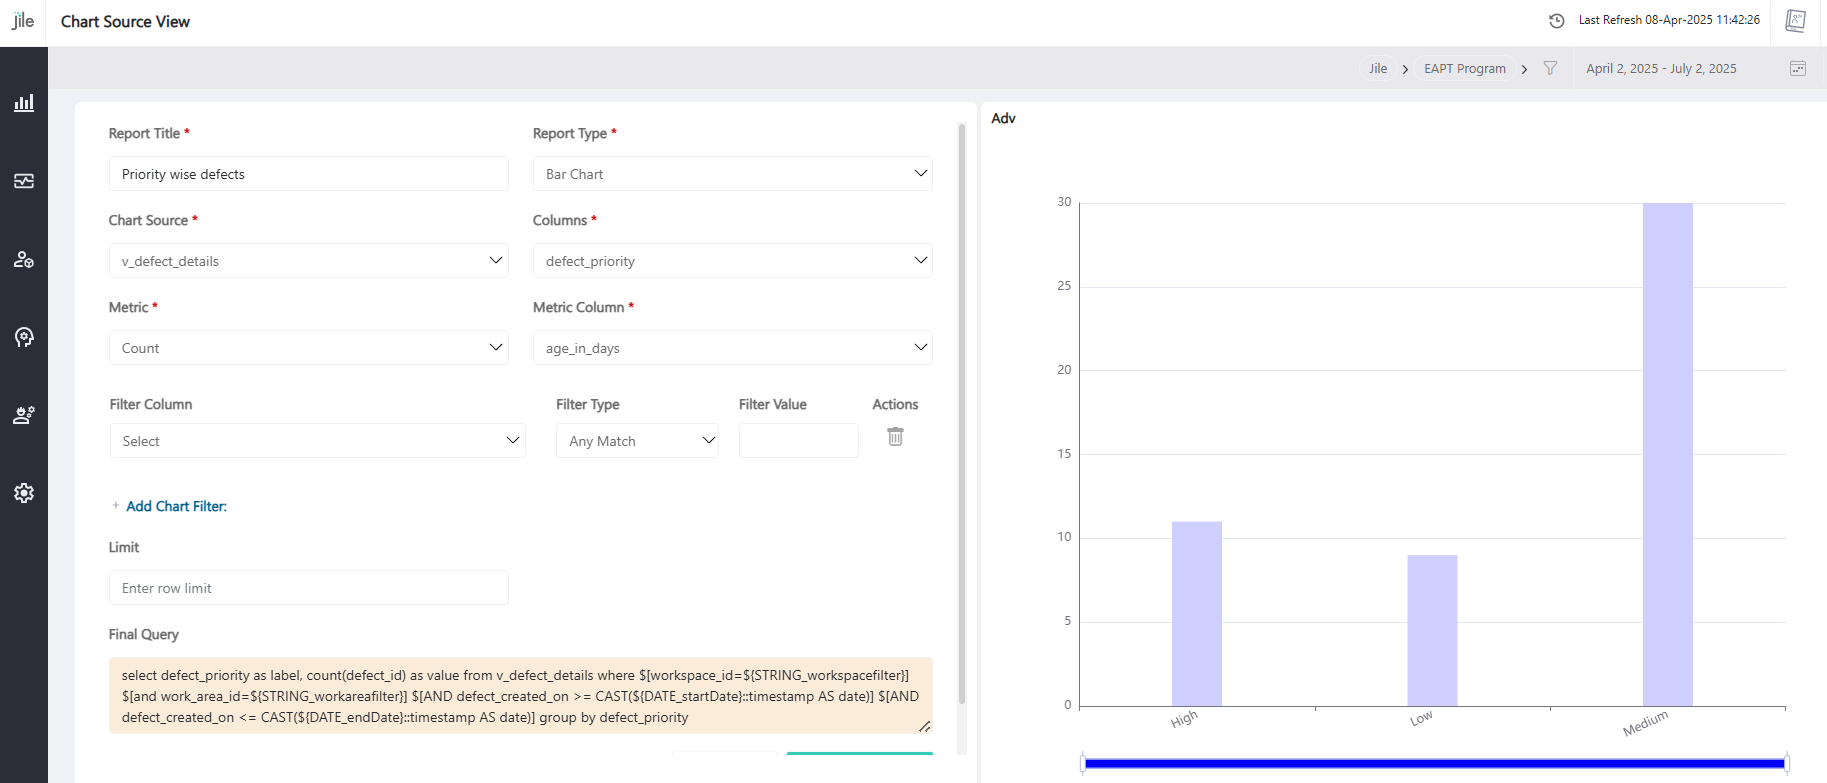
Create and customize data visualizations by selecting a preferred chart type through the 'Chart Source View' page along with a comprehensive filtering system to refine visualizations.
Here's What is New
- Additional visualization types, including bar charts, line charts, and pie charts.
- Configure charts through dropdown selections such as chart source, data columns, and metrics (count, sum, min, max, and average) with the flexibility to apply metrics to specified columns.
- Acceptance criteria.
Chart Type Selection
- Tabular (existing functionality)
- Bar Chart
- Line Chart
- Pie Chart
The selected chart type correctly displays data based on the data source and user selections.
Data Source and Column Selection
- A 'Chart Source' dropdown allows users to select the data source for the chart.
- A 'Columns' dropdown displays all the available columns from the selected data source.
Metric Selection
Users can choose a metric to apply to a selected column from the following options:
- Count
- Sum
- None (no metric applied)
- Min
- Max
- Average
The 'Metric Column' dropdown allows users to select the specific column to which the metric will apply.
Filter Functionality
Users can choose a metric to apply to a selected column from the following options:
- Filter Column dropdown displays all the columns available in the 'Columns' dropdown.
- Filter type options include:
- Any match
- Exact match
- Starts with
- Ends with
- Filter valueallows users to enter specific values for filtering.
- A '+' button allows users to add multiple filters, with each filter applied to the displayed chart.
Filter Application
- Apply multiple filters simultaneously, with correct handling of different filter types and values.
- Dynamically update the chart to reflect the applied filters and displays only relevant data.
Chart Rendering and Responsiveness
- All chart types (tabular, bar, line, and pie) render correctly based on user selections and filters.
- The page layout remains responsive and functional on various screen sizes.
Error Handling and Validation
- If incompatible or invalid data or filters are selected, an appropriate error message appears.
- Only compatible filters and metrics are displayed based on the selected chart type.
User Interface and Usability
- Dropdowns, selection options, and the '+' button function as expected.
- Selections are clear, easy to understand, and visually consistent with the rest of the UI.
What Makes This Update Useful
- Improves data analysis capabilities, enabling users to visualize trends and patterns more effectively.
- Enhances data control using a comprehensive filtering system, allowing users to refine their data with criteria such as any match, exact match, starts with, or ends with.
- Offers selections based on the available columns, and a filter value can be applied to pinpoint specific data points.
- Stacks multiple filters using the 'plus' button, creating advanced, multi-level filtering for a more tailored data experience.
Charts Repository Enrichment
Charts Repository Enrichment feature enhances Jile reports by providing enhanced visual representation of key performance indicators with user-friendly interface, real-time updates and export options.
Analytics
2 mins read
Data Analytics provide actionable insights with predictive and prescriptive information.
Effort and Defect Prediction Models
These models help with the analysis for effective project planning and resource allocation.
Here's What is New
- Data Preparation
- Model Selection
- Model Training
- Model Testing
- Model Implementation in CDMS
- Model Testing Post Implementation
- Visualization
This model leverages historical project data and Machine Learning algorithms to provide more accurate and reliable effort estimations.
What Makes This Update Useful
- It helps improve project planning and resource allocation.
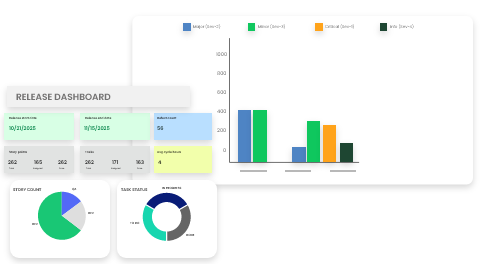
Release Dashboard
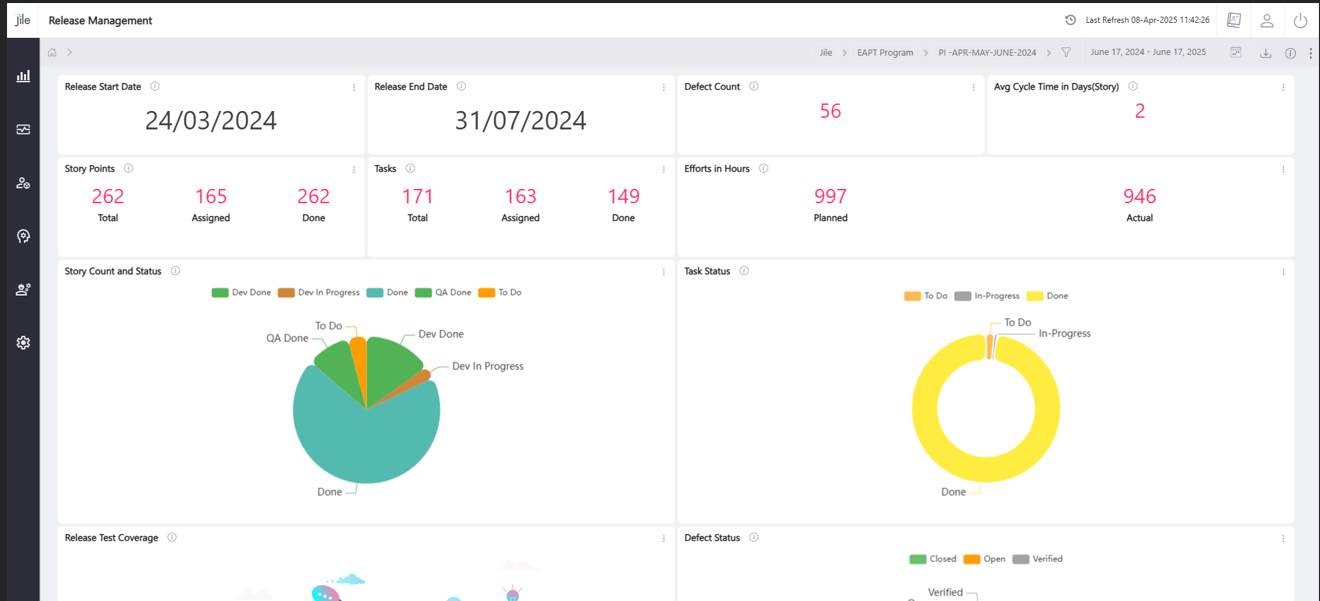
The all-new Release Dashboard provides key release management data.
Here's What is New
With this dashboard, we can track:
- How many tasks, stories, and sprints are completed by the team?
- How do our tasks break down by priority level?
- What is the status of our releases?
- How many story points are completed per component?
Release-specific Metrices Included in This Update
- Release Start Date
- Defect Status
- Story Count Overview
- Release End Date
- Task List Report
- Story Points
- Task Status
- Release Test Coverage
- Effort in Hours
- Iteration Velocity
- Defect Count
- Avg. Cycle Time
- Completed Story Points Trend
- Release Burndown Chart
- Incomplete Tasks Overview
- Scope Changes
- Team Task Breakdown
- Test Case Priority
- Assignees by Role
What Makes This Update Useful
- Find all the relevant Key Performance Indicators (KPIs) in one place for better understanding and informed decision making.
- Download the dashboard as an image to be shared with the stakeholders.
DevSecOps

Provides the insights module for pipeline configuration offered as a 'Pipeline as a code' capability.
DevOps Research and Assessment (DORA) Metrics - Marts and Visualization
Here's What is New
- Analysis and Data Gathering from DevSecOps (DSO)Insights
- Bringing Data in D2
- Enhancements to Data Marts
- DevOps Research and Assessment (DORA) Viz
What Makes This Update Useful
- Streamlined data gathering through the integration of DSO insights and D2 and enhanced Data Marts, allowing users to easily access DORA metrics and utilize DORA dashboard.
- Compare their DORA metrics against industry standards.
Jile GitLab Integration Feature - Tasks to Issues
2 mins read
- This feature outlines the configuration and functionality of the integration between Jile and GitLab (GitLab is the Source Code Management utility which handles all development activities such as code branching, code patches and merges).
- This integration enables seamless creation and management of GitLab issues directly from Jile and ensures synchronization between tasks and issues. Additionally, webhook updates from GitLab to DevPlus ensure that the task and issue statuses are in sync.
- This feature helps developers to link development tasks to the issue entity in GitLab, thereby establishing a traceability between code merges in GitLab with the user story.
- The integration allows multiple GitLab projects to be associated with a single Jile task, with the ability to update, add, or remove projects.
Here's What is New
- Select multiple GitLab projects to create the issues in Git Lab when creating or editing a task in Jile.
- Only the projects within specific configured GitLab group IDs appear if the group ID is configured.
- If the group ID is not configured at the workspace level, all the projects within the GitLab URL configured in the domain setup will be shown.
- Task status, effort, and owner will be synchronized between Jile and GitLab.
- Manage the task status and update the effort based on GitLab issue closure using Webhooks and APIs.
- If the Source Code Management system is GitLab, Jile supports connectivity to GitLab. When a Developer creates a development task, a GitLab issue is created in each of the GitLab projects selected and linked to the task.
- Based on the actions being performed in GitLab to close code change activities related to the GitLab issue, tracking and monitoring can be performed in Jile.
- Closure of all related issues will allow the closure of the task in Jile.
What Makes This Update Useful
- Easily manages development tasks.
- Enables seamless tracking and reporting of code change.
- A good fit for scenarios where GitLab is the Source Code Manager.