Scrum Agile Project Management Software
Multiple teams, one dream
Get higher value from your teams to deliver products faster to the market by envisioning outcome and measuring continuous progress.
Multiple organizations have benefited from our Scrum platform
Visualize the eventual from the beginning
Gain complete visibility of your scrum development work
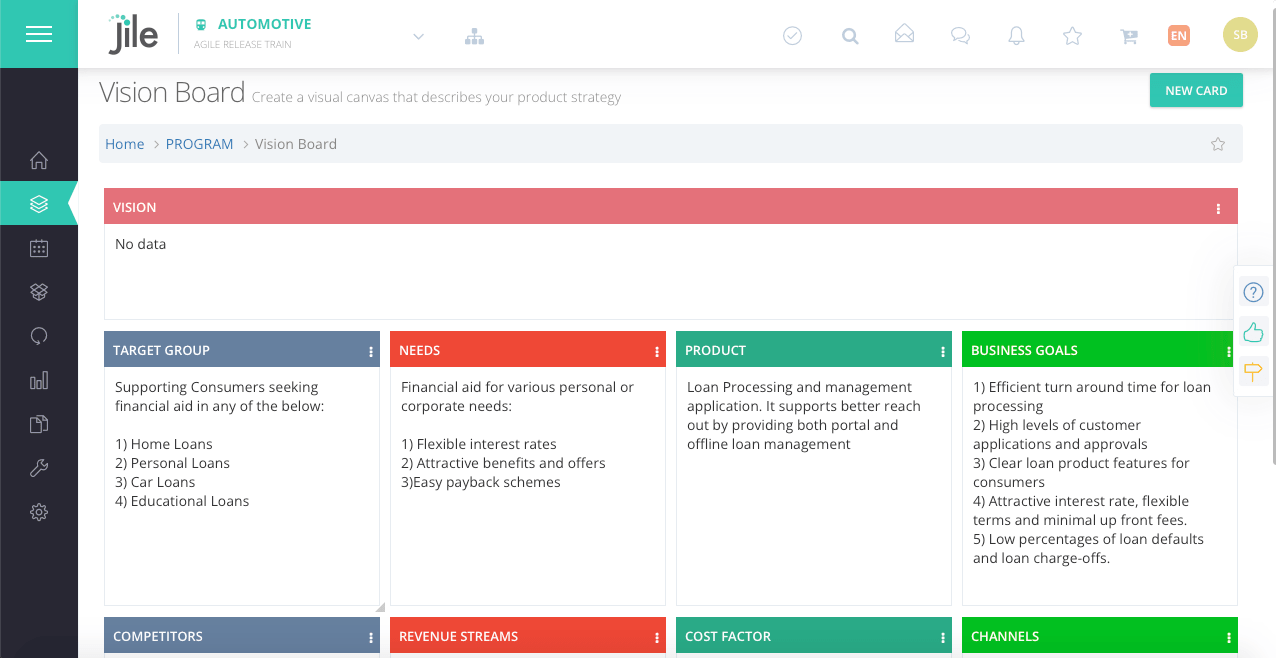
Vision
The big picture
Up your game with a powerful vision board to deliver products that outlive promises through performance.
Build better, track smarter, progress faster using our visual board.
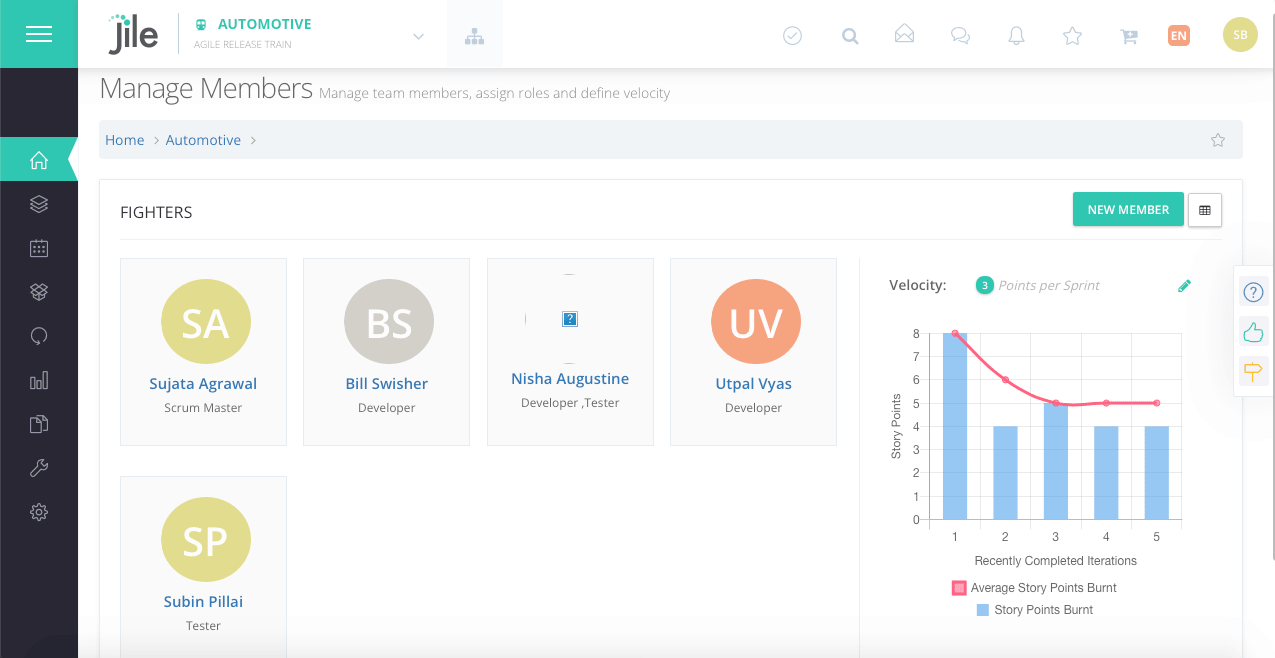
Team Onboarding
Build a winning team
Onboard a dedicated group of cross-functional professionals to build product-consumable software in an incremental and iterative fashion to deliver business value. Configure specific team member roles, and manage team velocity and story points.
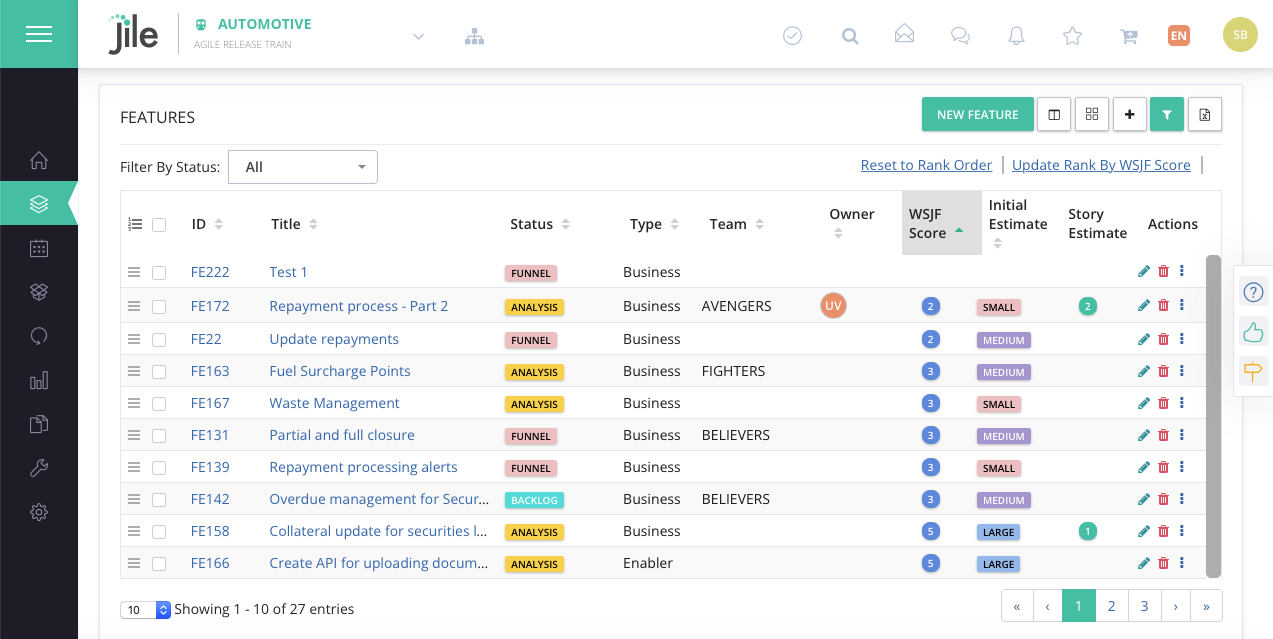
Backlog
Prioritize by importance
Create backlogs and address the most important aspects first to help the team deliver higher business value sooner. Product owners can quickly add features into the backlog, provide detailed description of each feature, define the benefits and acceptance criteria, and attach supporting documents.
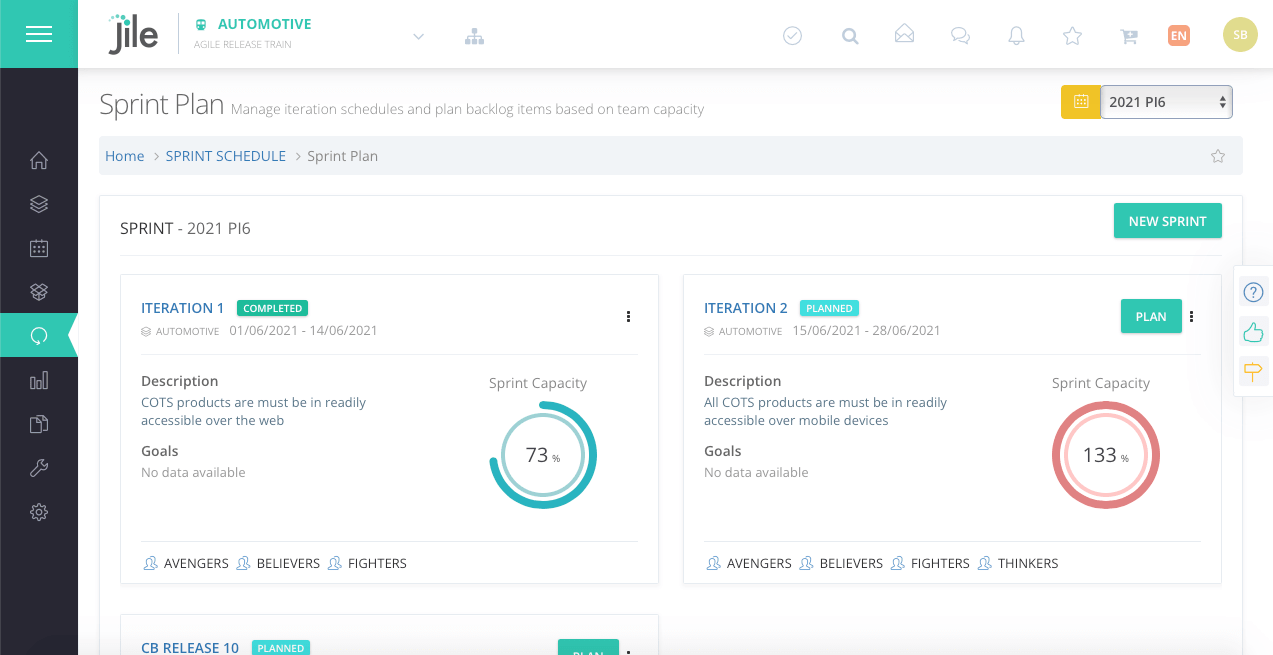
Sprint Planning
Sprint ahead of the competition
Help your software, business, and support teams to stay ahead of the curve through progressive sprint planning. With an intuitive planning board and live indicators, teams can plan user stories and tasks into iterations and sprints based on their capacity.
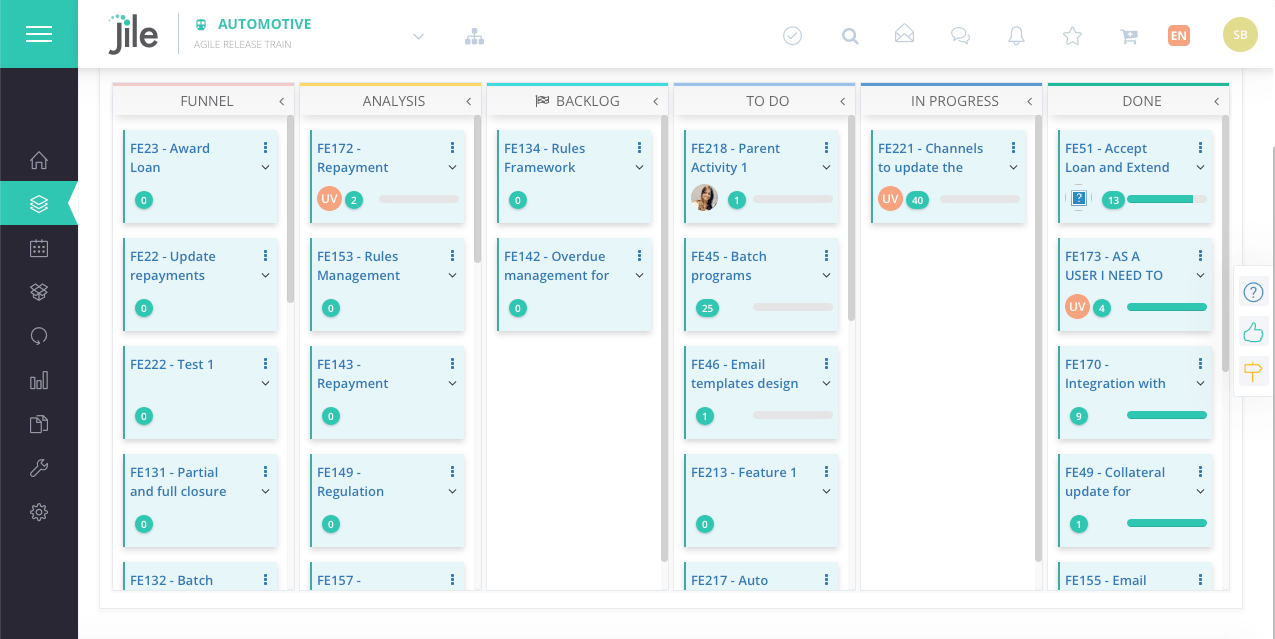
Sprint Execution
The smart way of working
Use the scrum board for daily scrums. Teams use this board to create new tasks, tag them to stories for execution, and log work hours. The scrum board helps in checking the availability and utilization of team members, and have a minimum viable product by the end of a sprint.
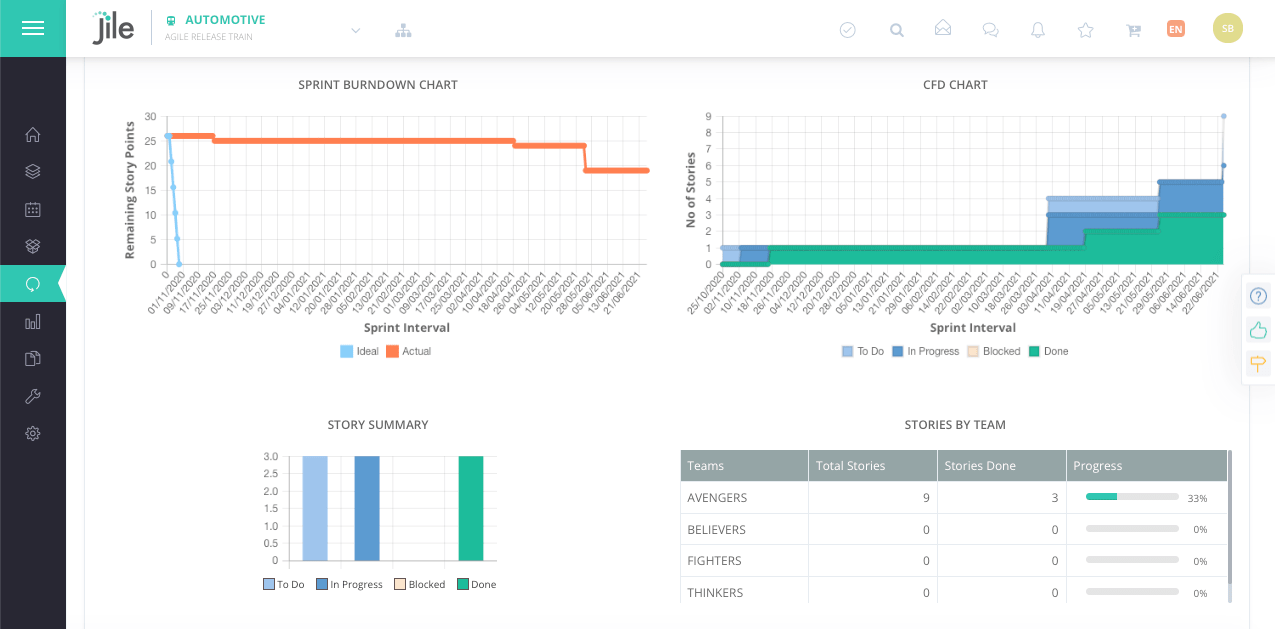
Track and Measure
Monitor every move
Track real-time progress of iterations visually, including all artefacts, sprint burndown reports and Cumulative Flow Diagrams(CFD). The sprint dashboard offers a visual representation of all the metrics in the form of charts, graphs, and tables. Track stories and tasks, status of impediments and dependencies to measure progress and head towards completion.
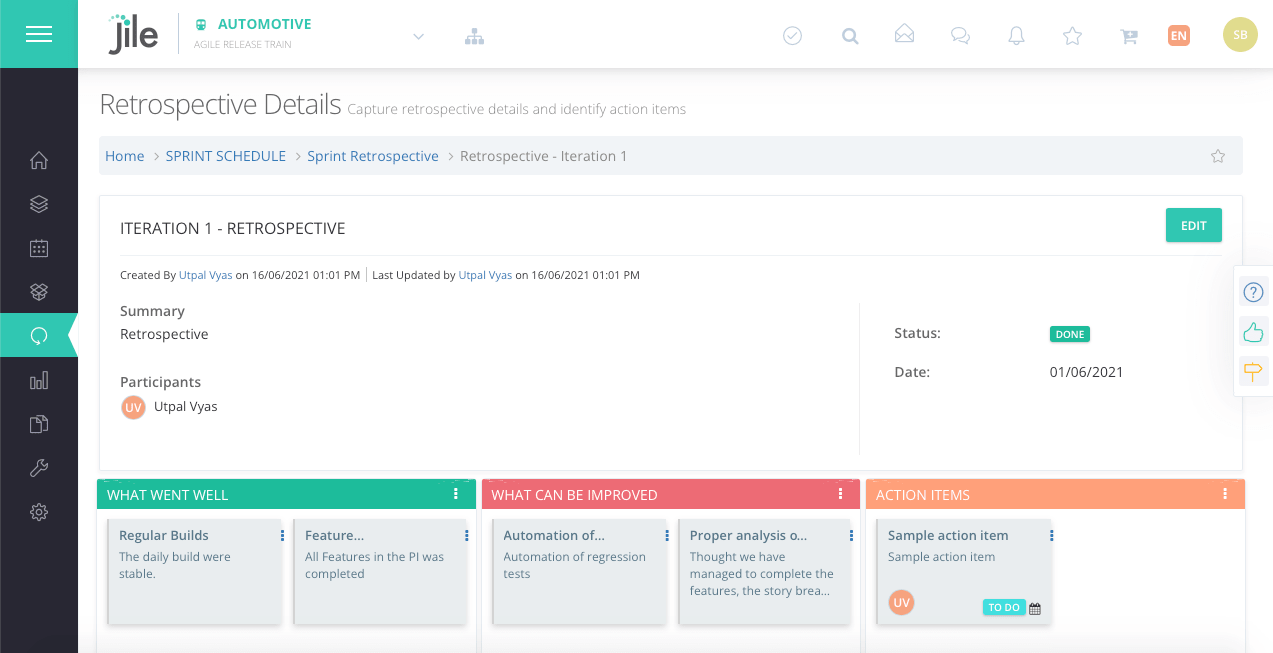
Close & Retrospect
Discover opportunities with Retrospectives
Close a sprint after all the stories and associated tasks are deemed done. Split partially completed user stories and move them to the next sprint. Retrospect to adapt, and identify opportunities for improvement in the next sprint.