Agile Work Management
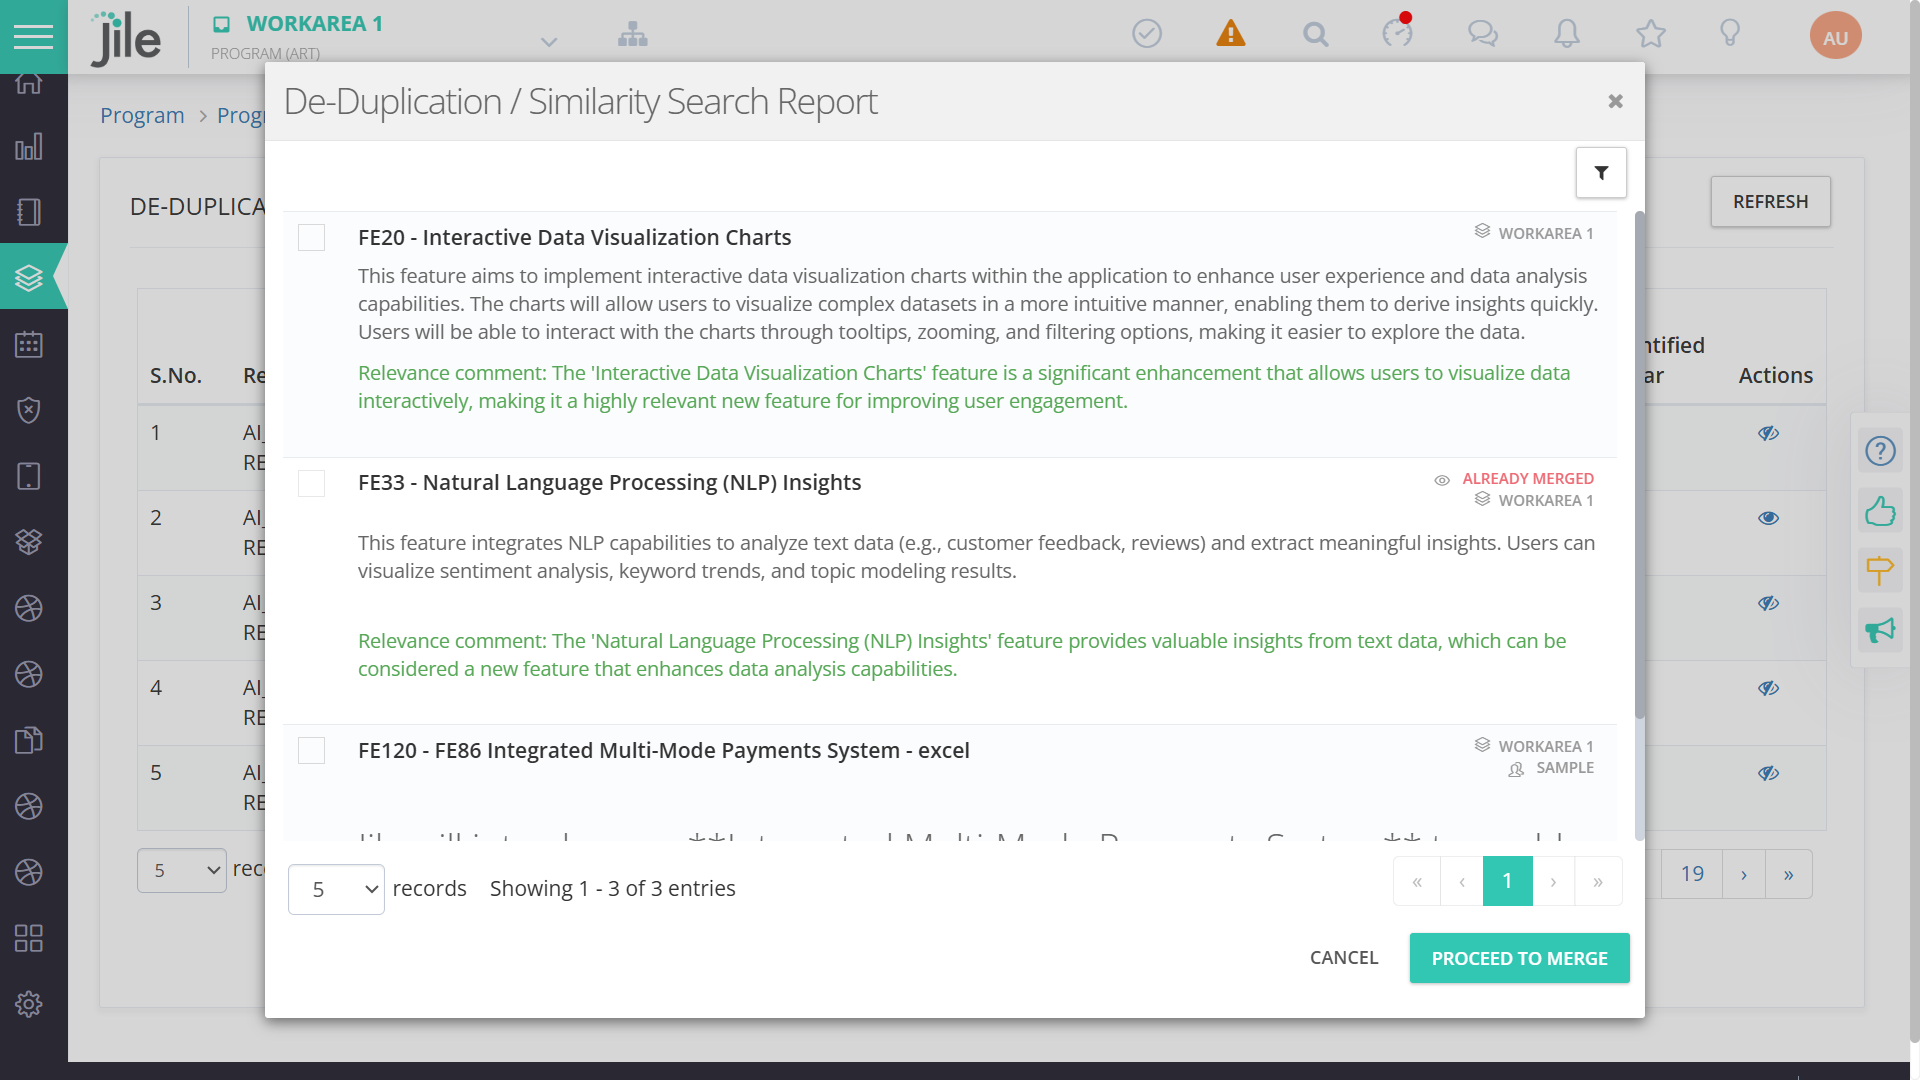
Enhanced Risk Planning and Ownership
Follow these steps to configure Risk Repository and manage risks
-
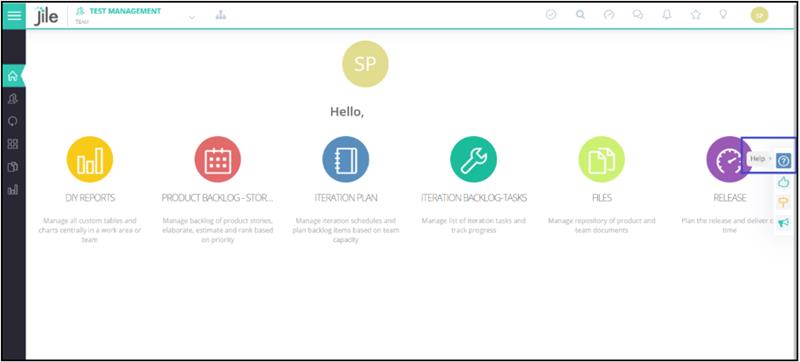
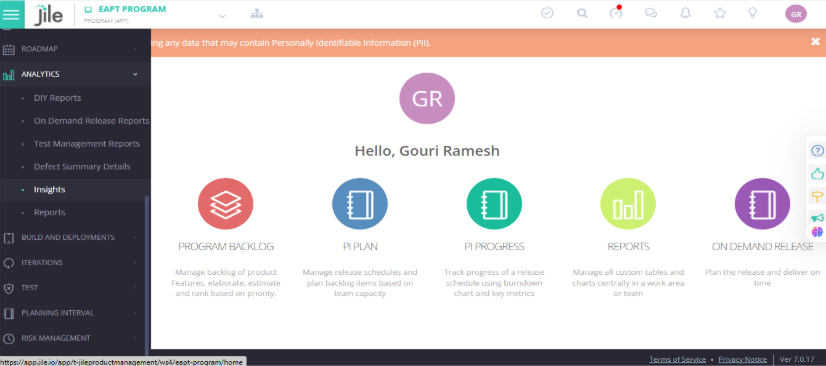
1: Login to Jile ALM UI
- Navigate to Jile Dashboard
- Navigate to Setup
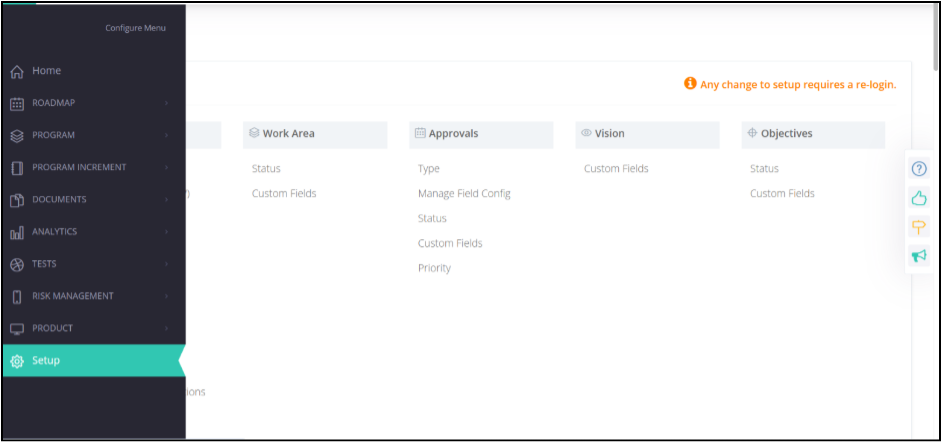
-
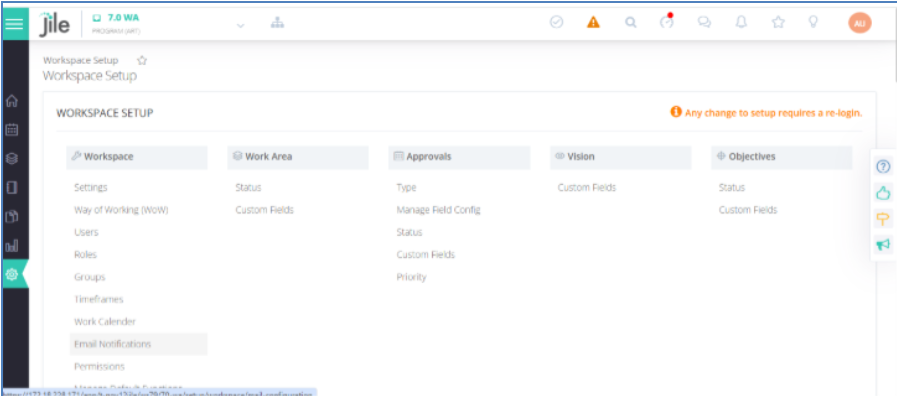
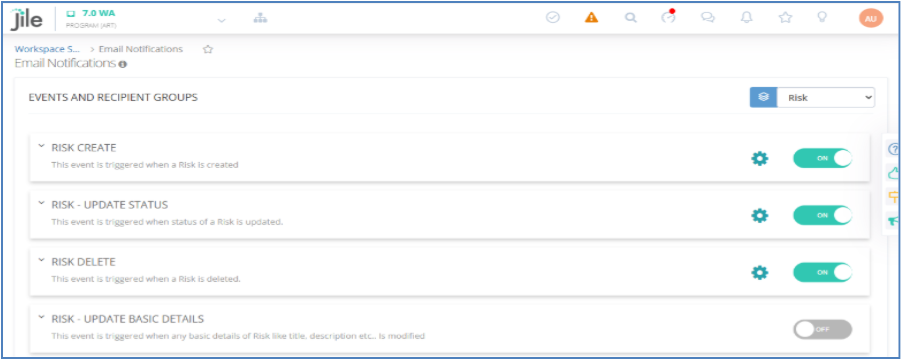
2: Click Email Notifications.
-
3: Enable risk events.
-
1: Login to Jile ALM UI
- Navigate to Jile Dashboard
- Click DIY Reports
-
2: Click the Add Table icon.
-
3: From the Entity drop-down, choose Risks.
-
4: Add the required fields and click SAVE to generate the report.
-
1: Login to Jile ALM UI
- Navigate to Jile Dashboard
- Navigate to Setup
-
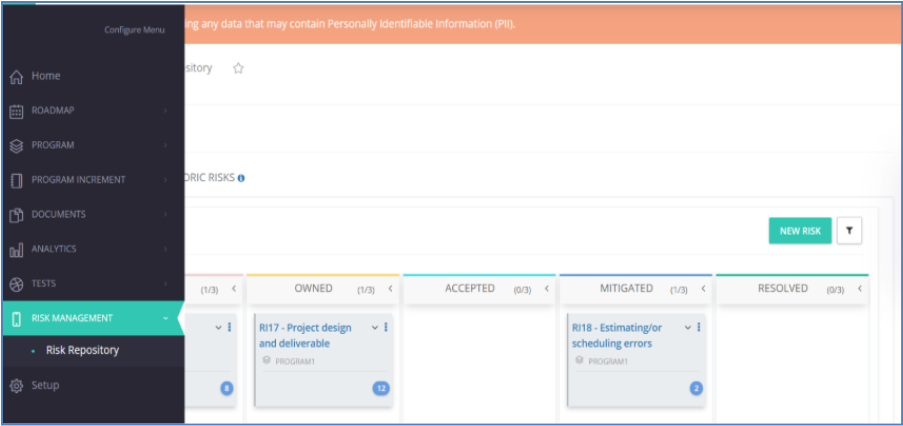
2: From the left menu, within RISK MANAGEMENT, click Risk Repository.
-
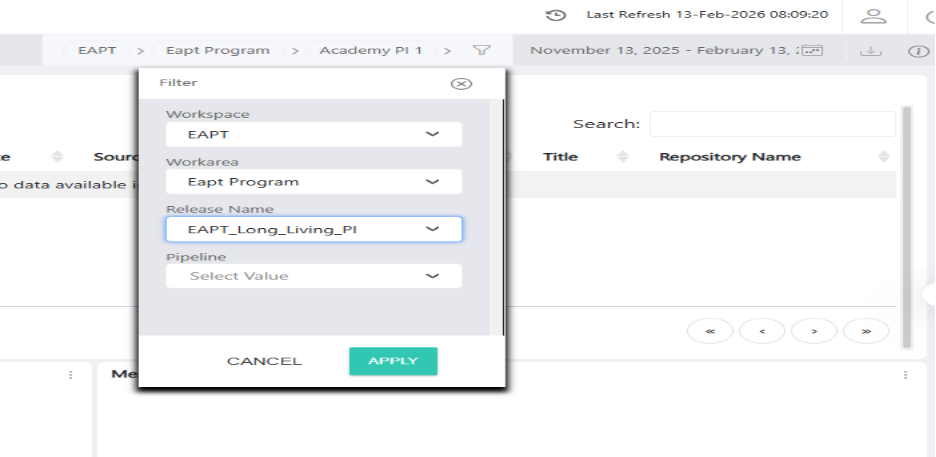
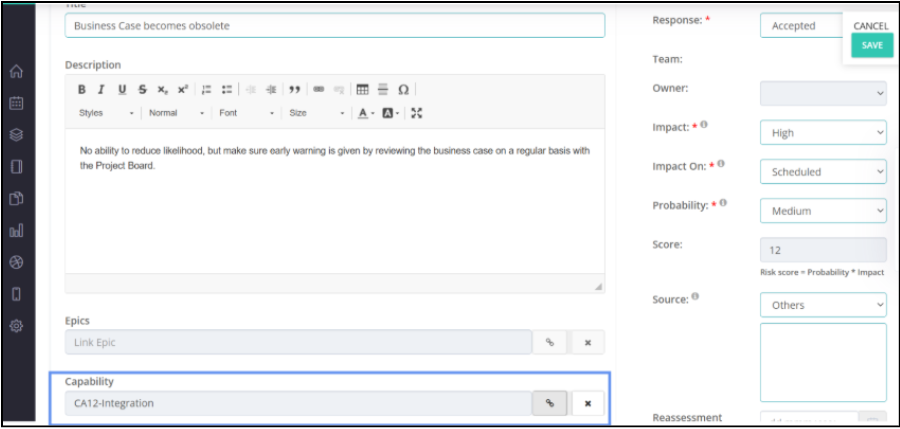
3: In the New Risk page,from the Program Increment drop-down, choose the required option.
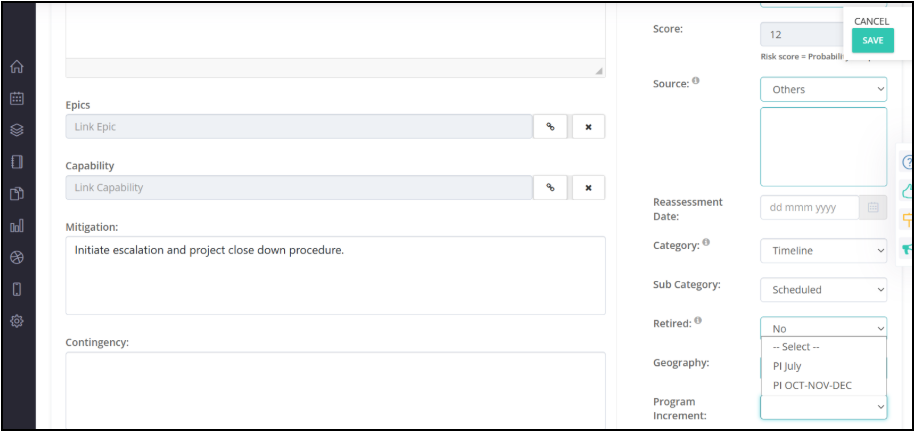
-
4: After selecting the Program Increment, click SAVE.
-
1: Login to Jile ALM UI
- Navigate to Jile Dashboard
- Click DIY Reports
-
2: From the left menu, within RISK MANAGEMENT, click Risk Repository.
-
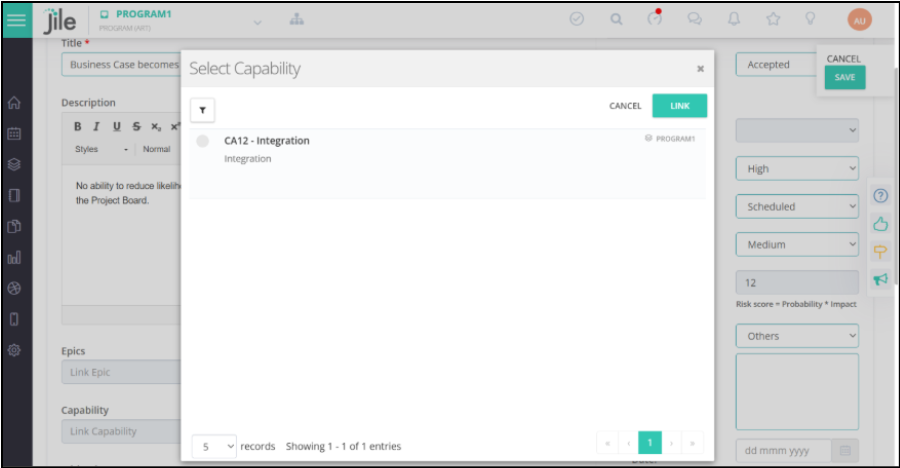
3: Select the capability to be linked and click the LINK button.
-
4: The selected capability gets linked to the risk.
-
1: Login to Jile ALM UI
- Navigate to Jile Dashboard
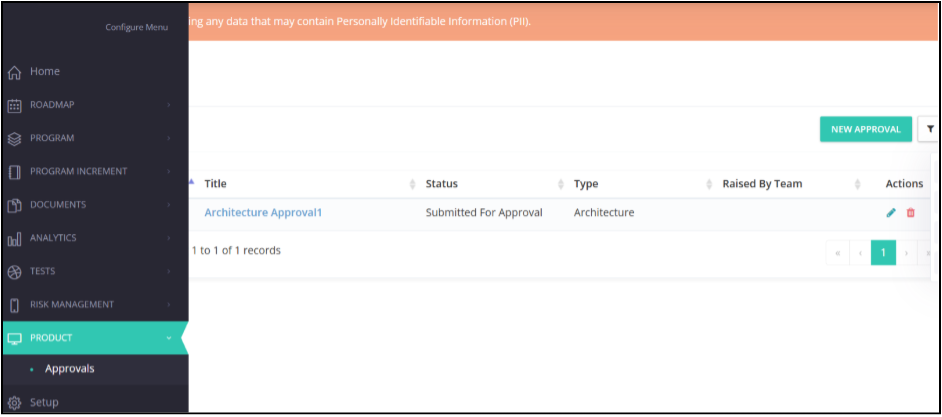
- From the left menu, within PRODUCT, click Approvals.
-
2: Select an approval and open it in Single Page View. Click Context menu.
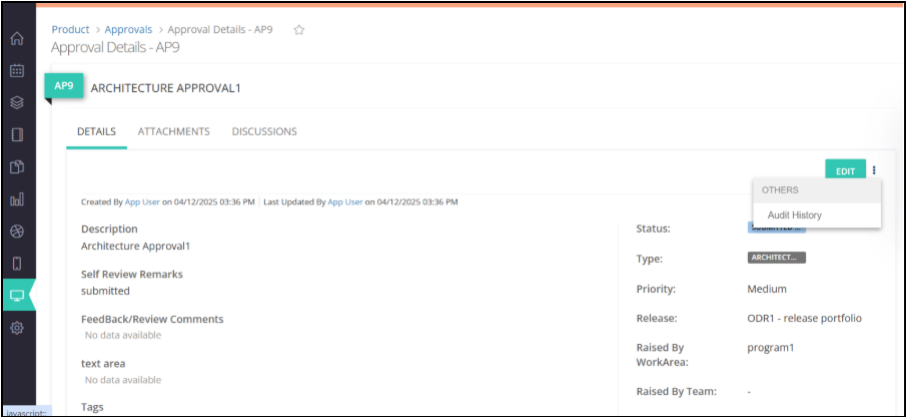
-
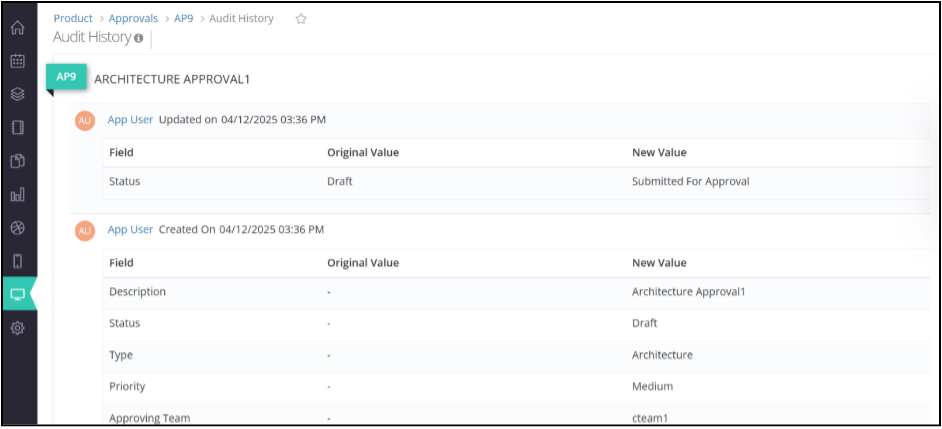
3: From the Context menu options, click Audit History.
-
1: Login to Jile ALM UI
- Navigate to Jile Dashboard
- From the left menu, click Setup..
-
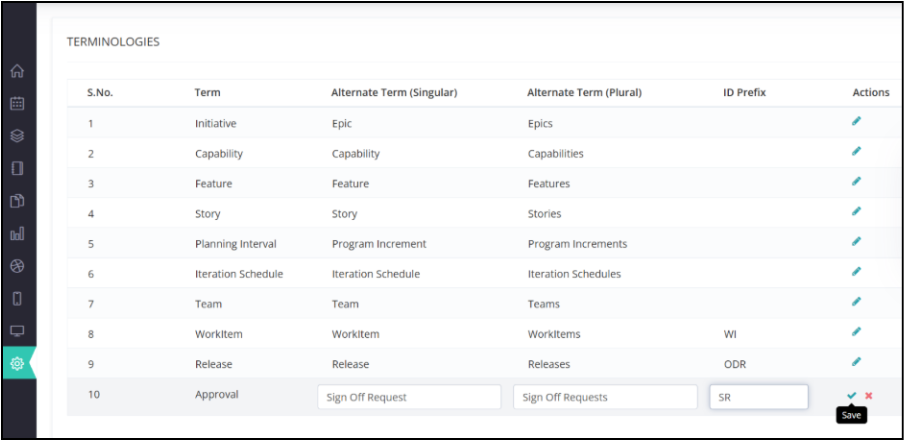
2: Access the Way of Working (WoW) section and scroll down to Terminologies.
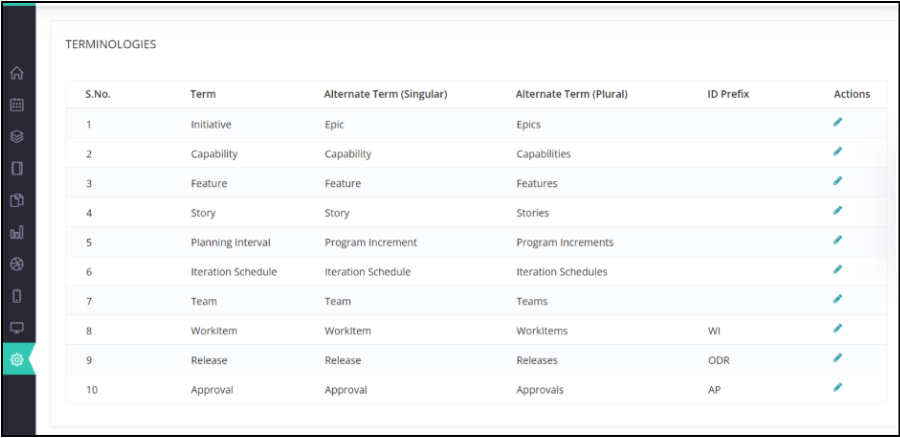
-
3: Modify the terminology based on your preference and click the tick mark to save.
-
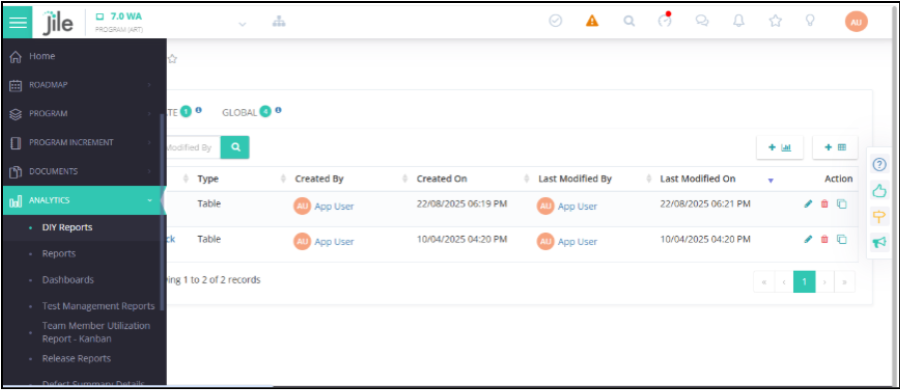
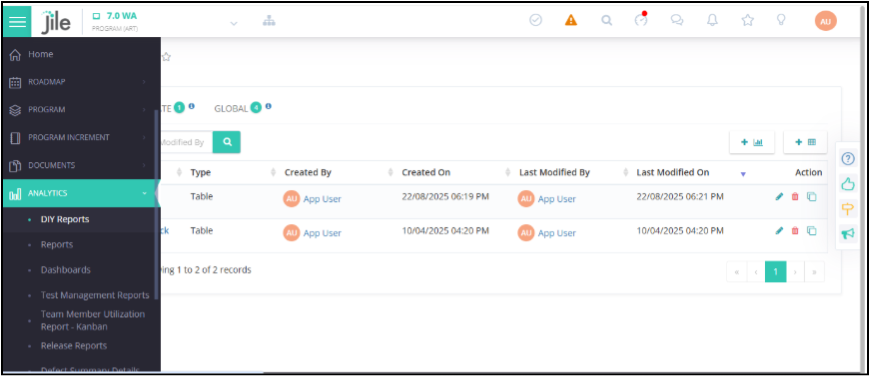
1: Login to Jile ALM UI
- Navigate to Jile Dashboard
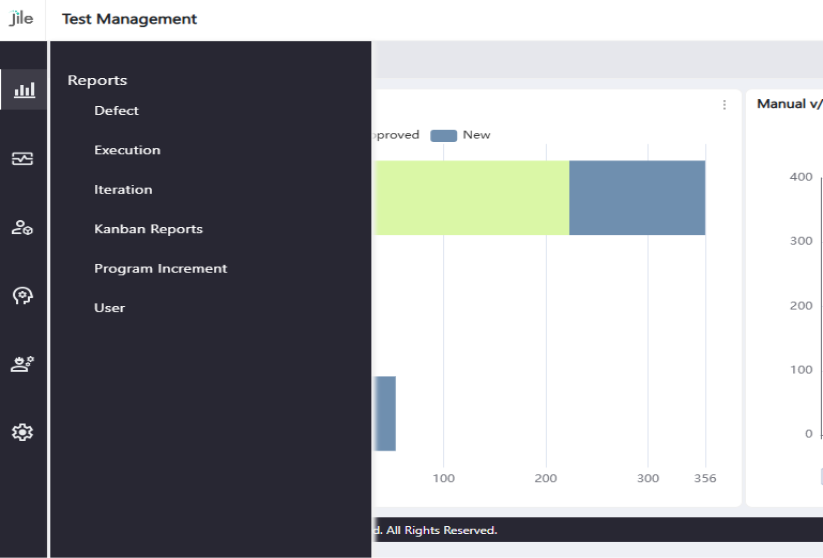
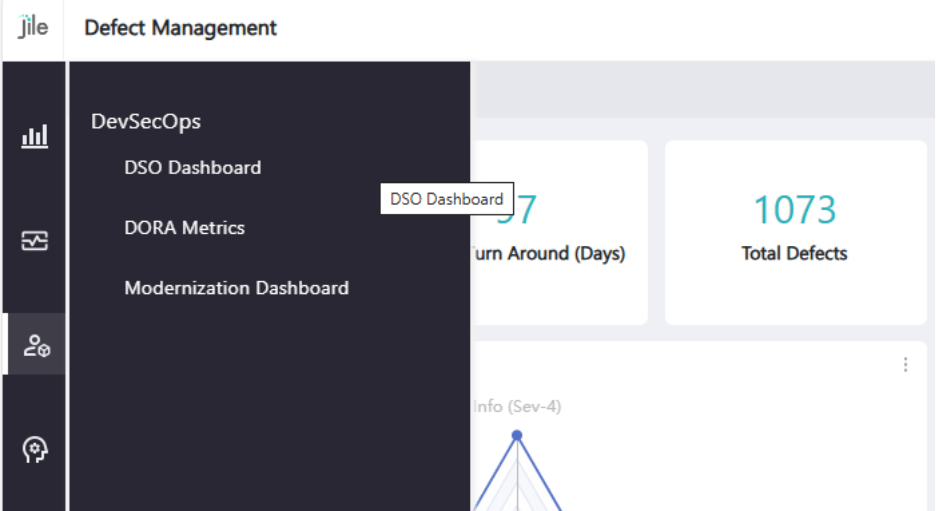
- From the left menu, within ANALYTICS, click DIY Reports.
-
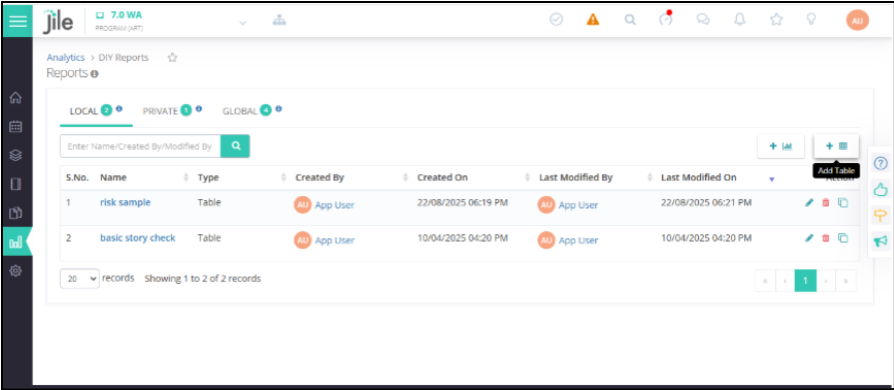
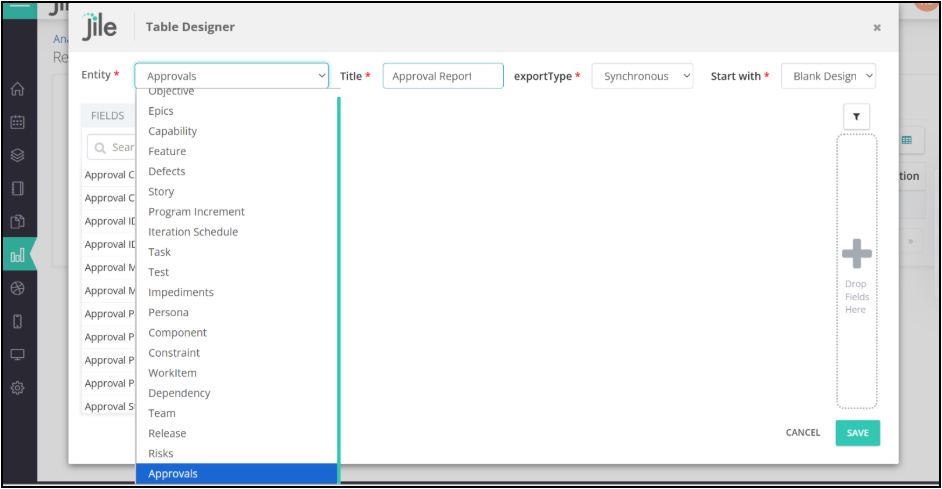
2: Click the Add Table icon.
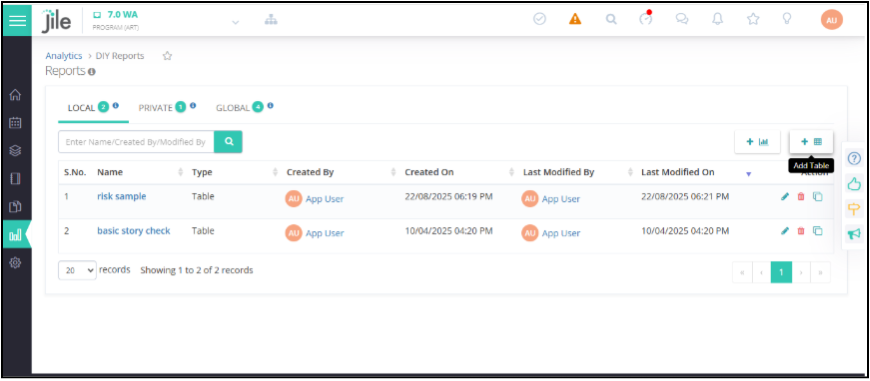
-
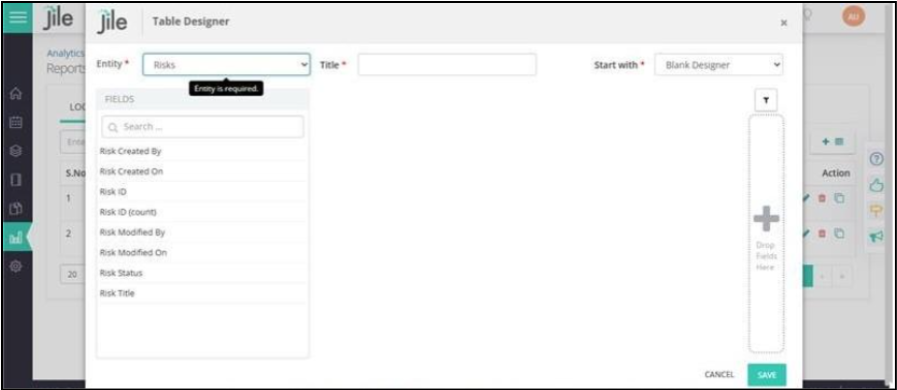
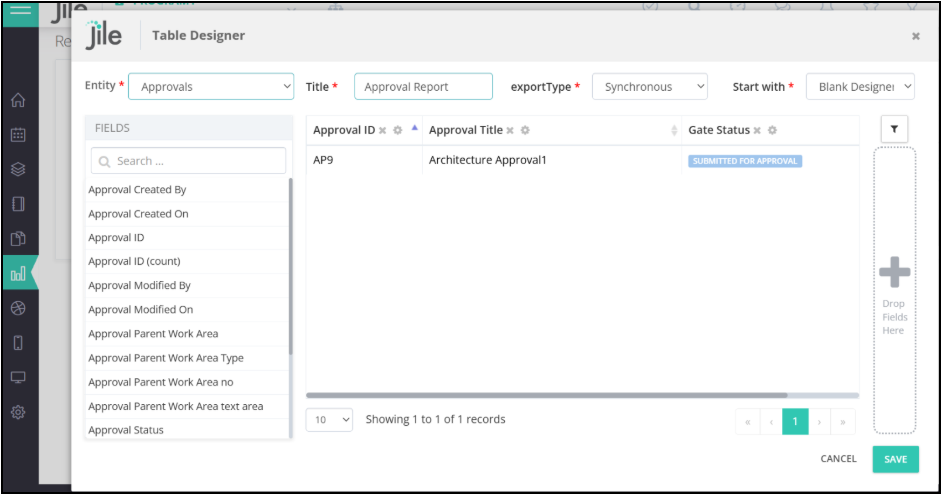
3: From the Entity drop-down, choose Approvals.
-
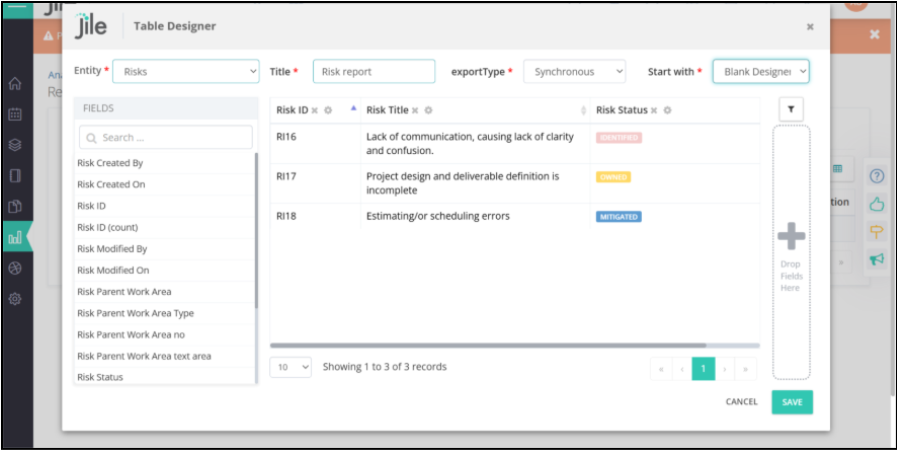
4: Add the required fields and click SAVE to generate the report.
-
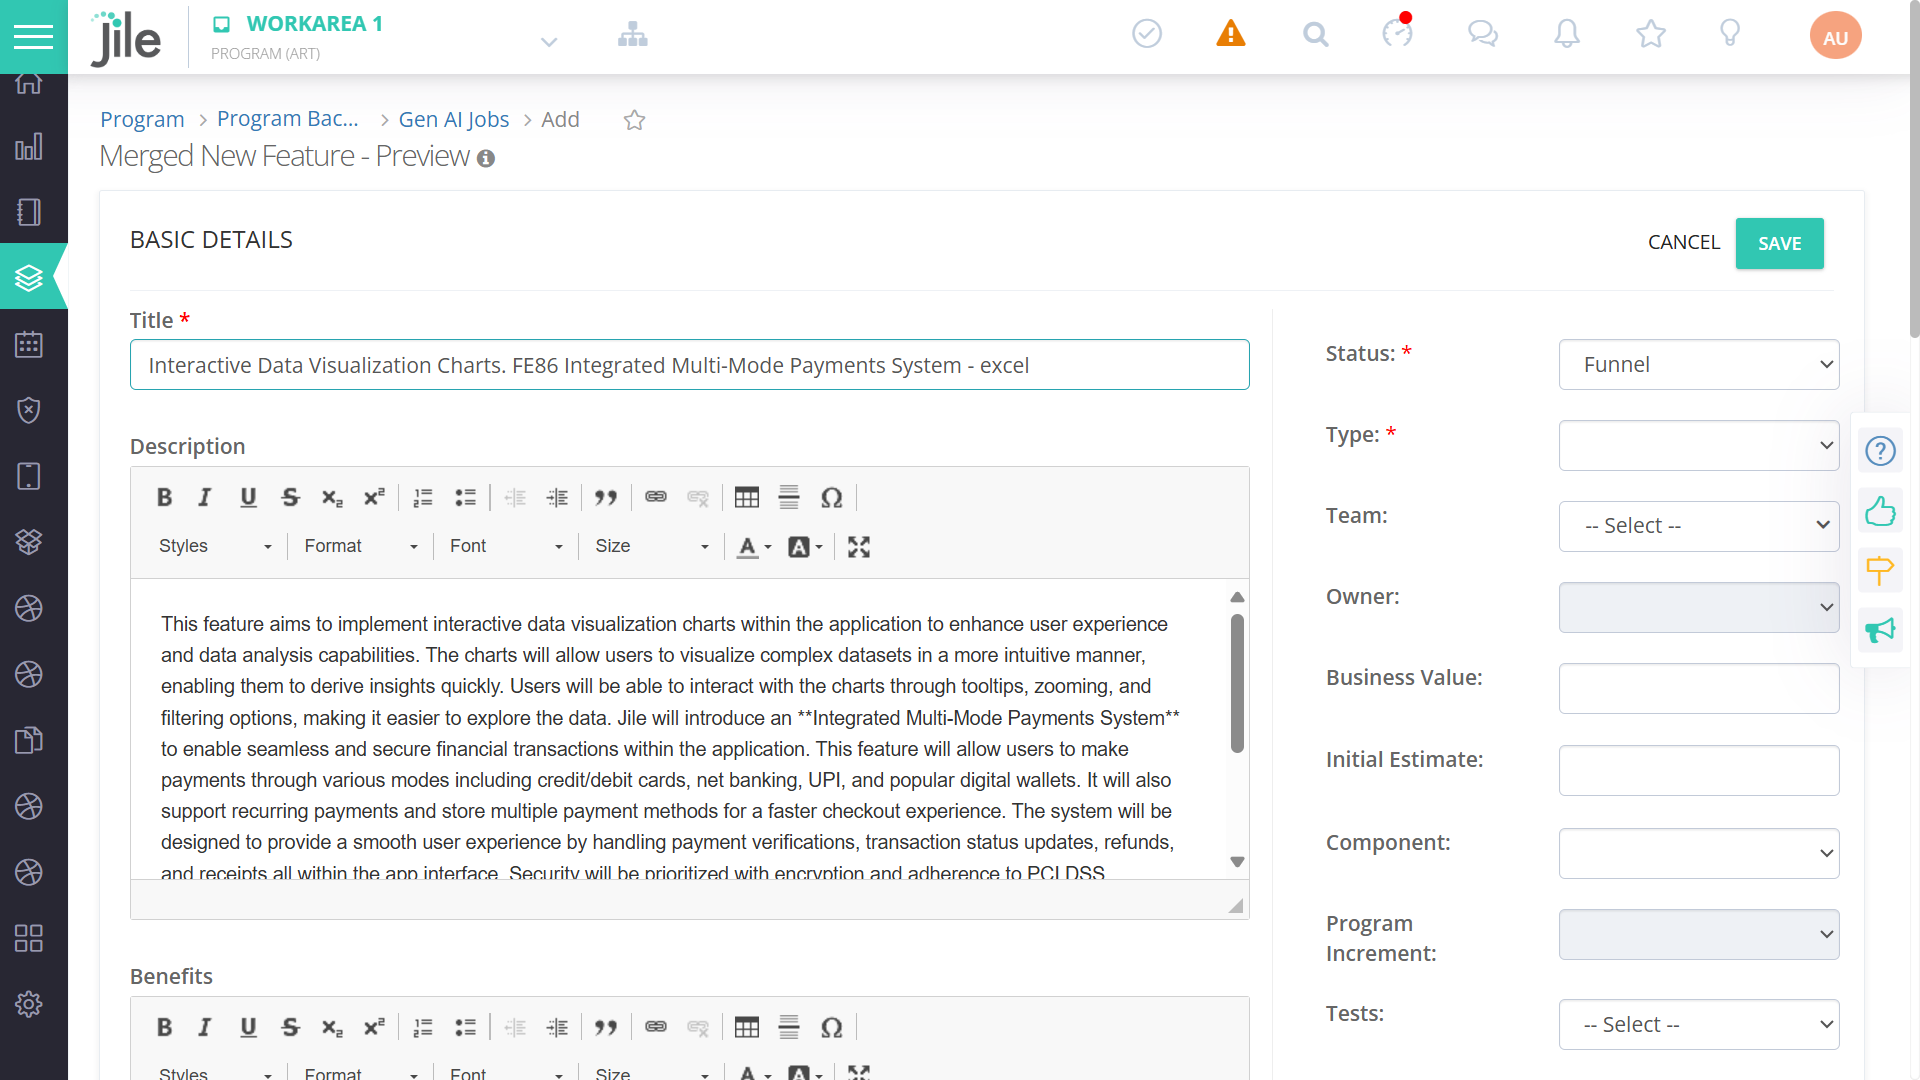
1: Click the drop-down located next to the workspace name. In the popover, click New Workspace.
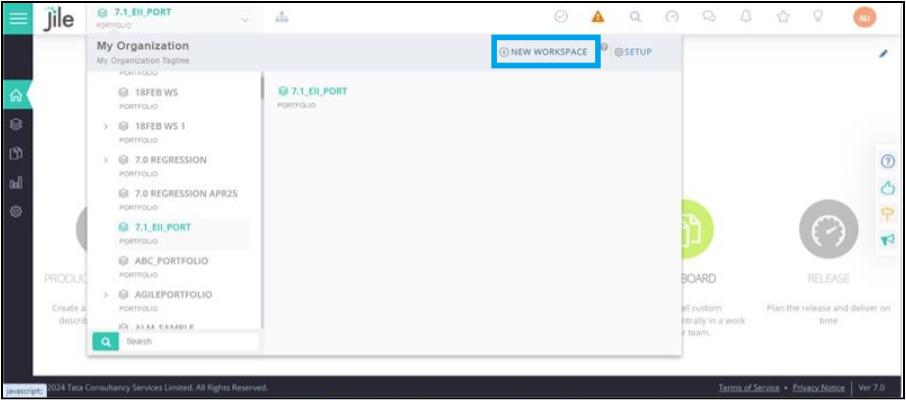
-
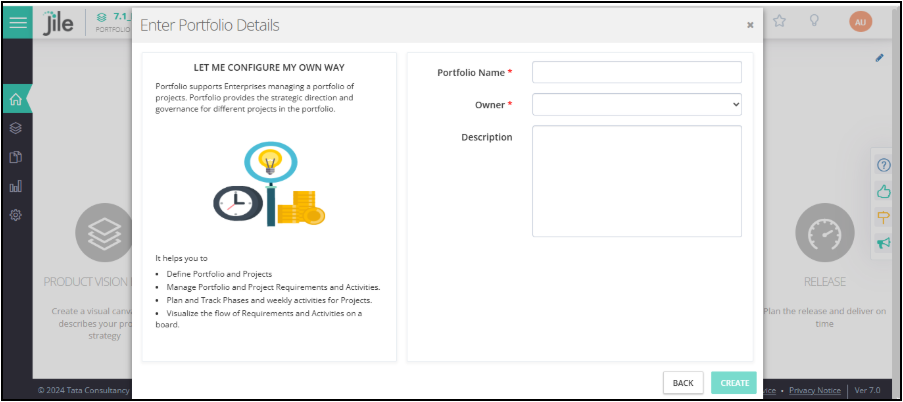
2: From the list of Wow types, click let me congfigure my own way.
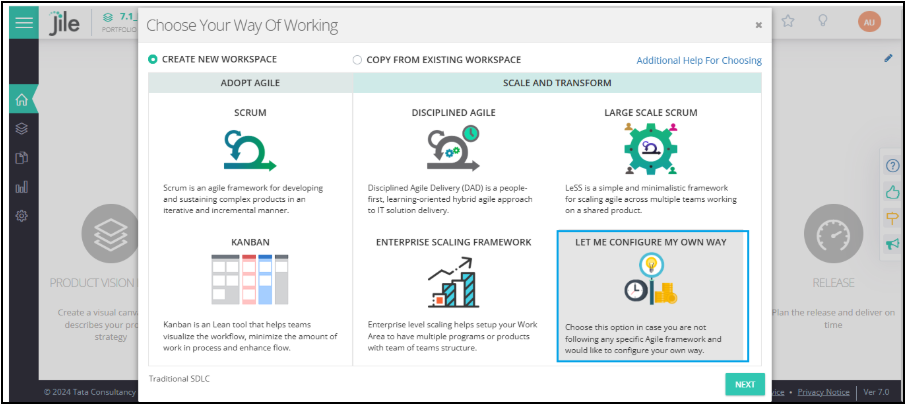
-
3: Enter workspace details and Create
- Fill up the required details for workspace creation and click CREATE.
- A new workspace is created with universal terminology.
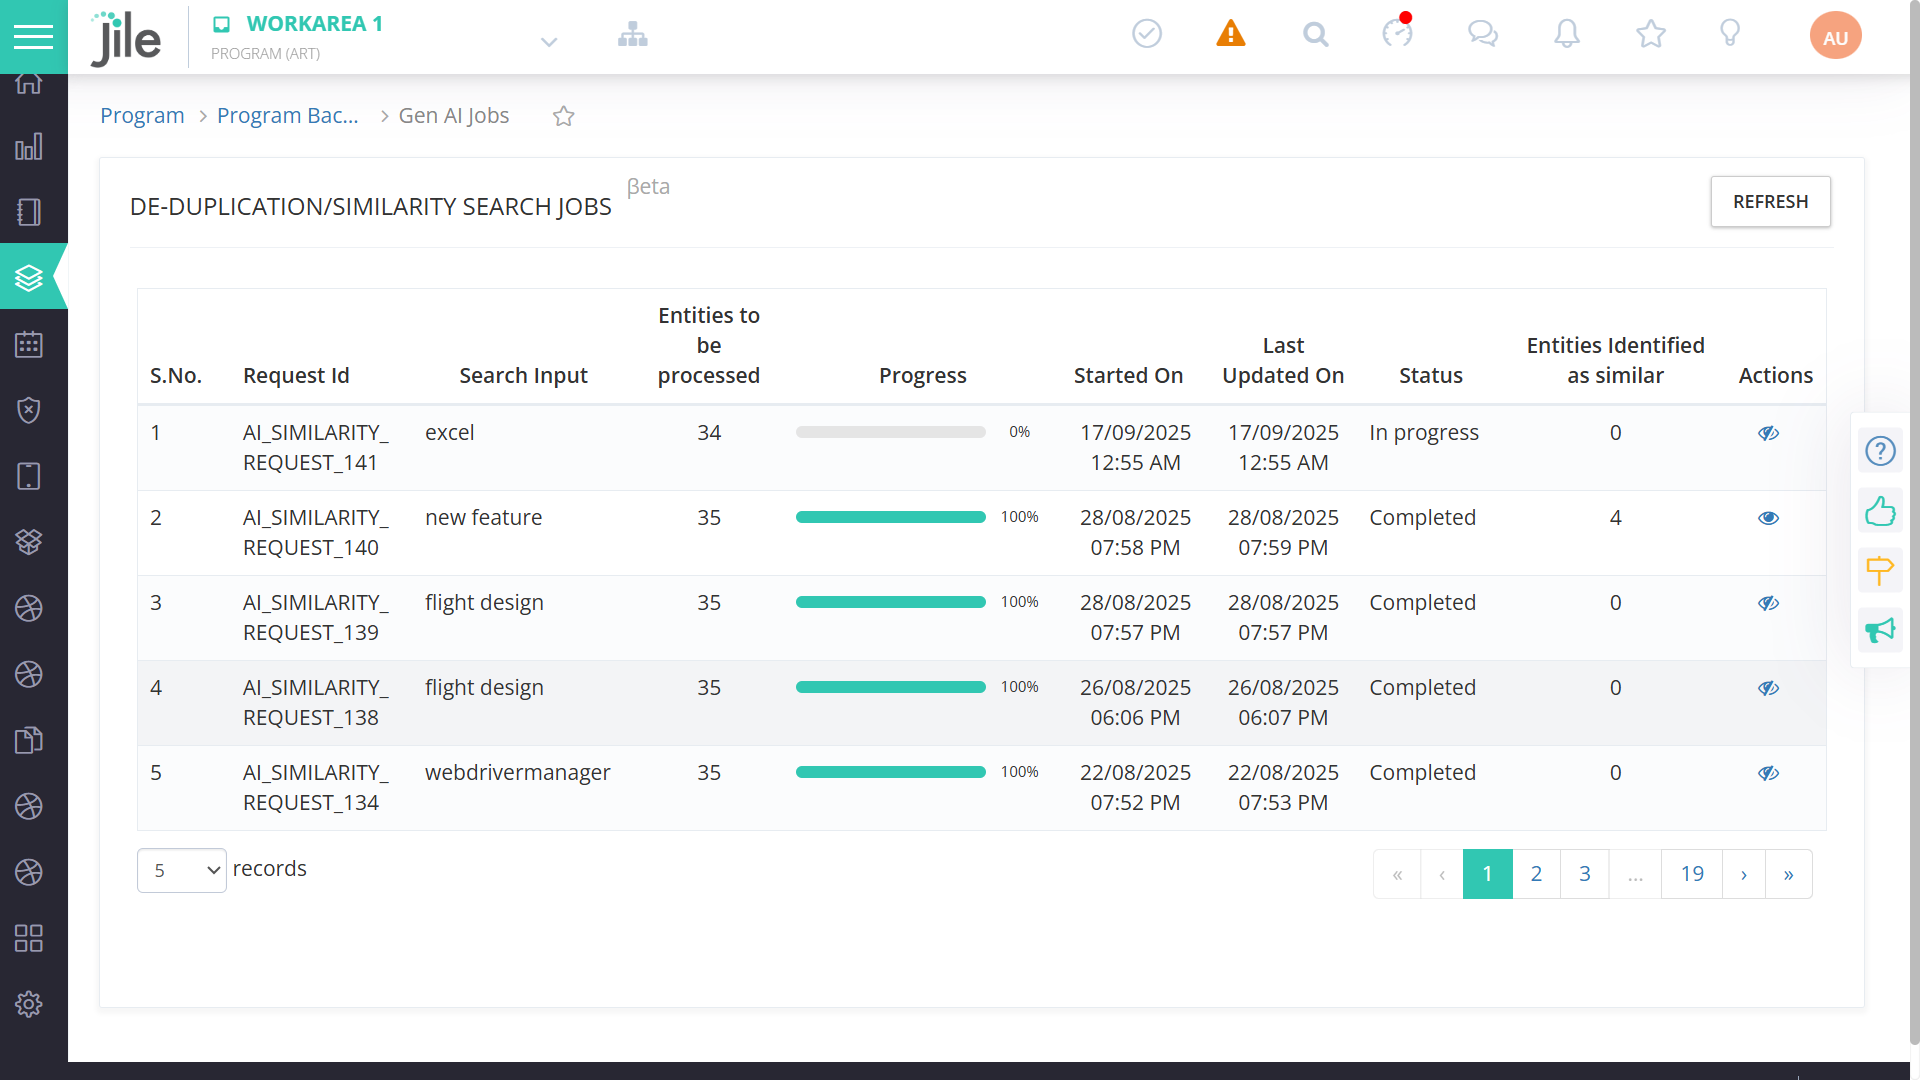
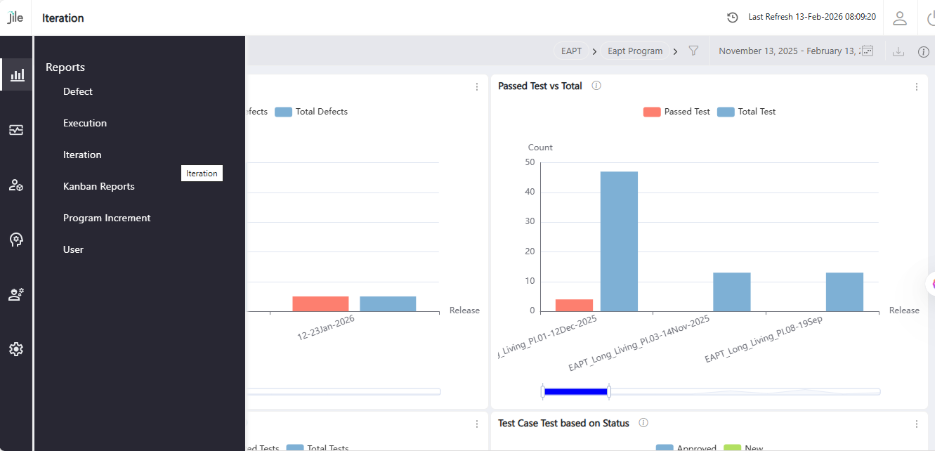
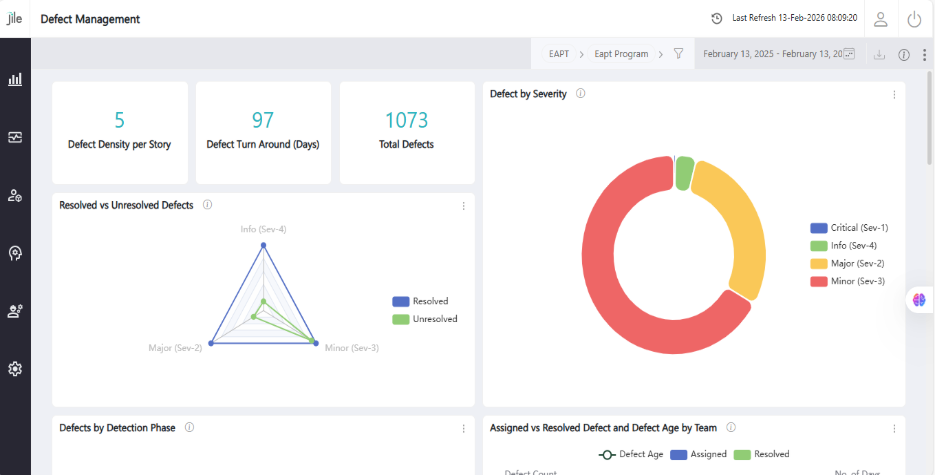
Including Risks entity in DIY reports
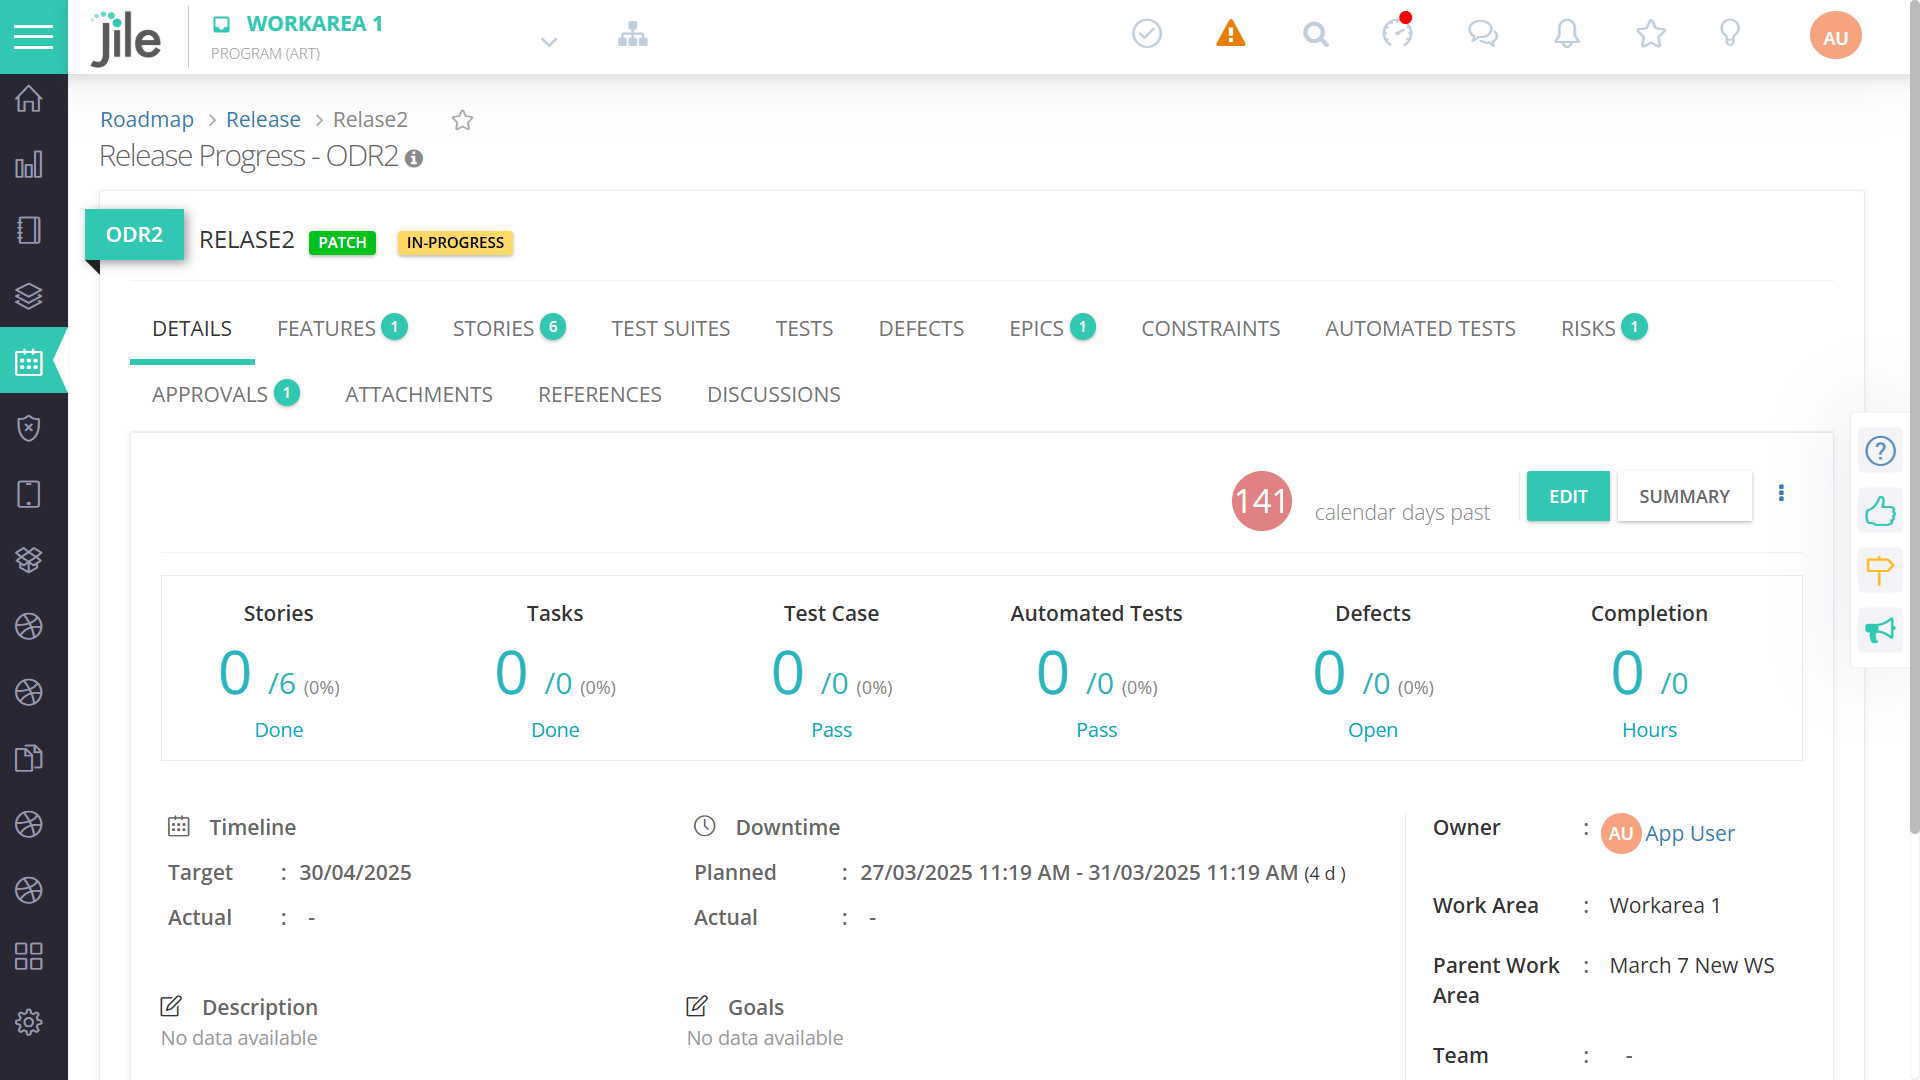
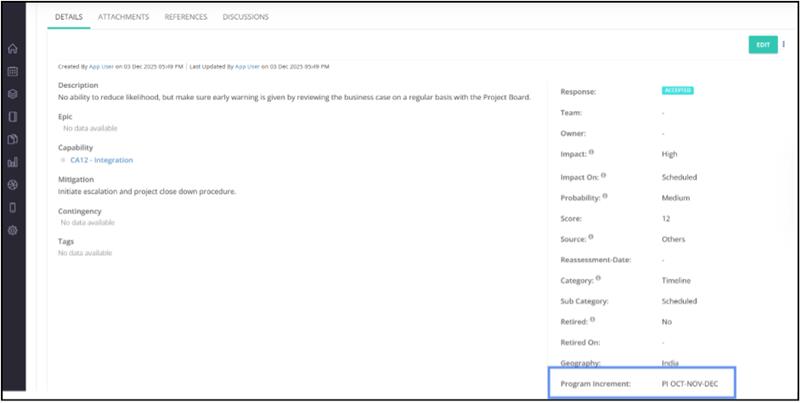
Tagging Program Increment to Risk
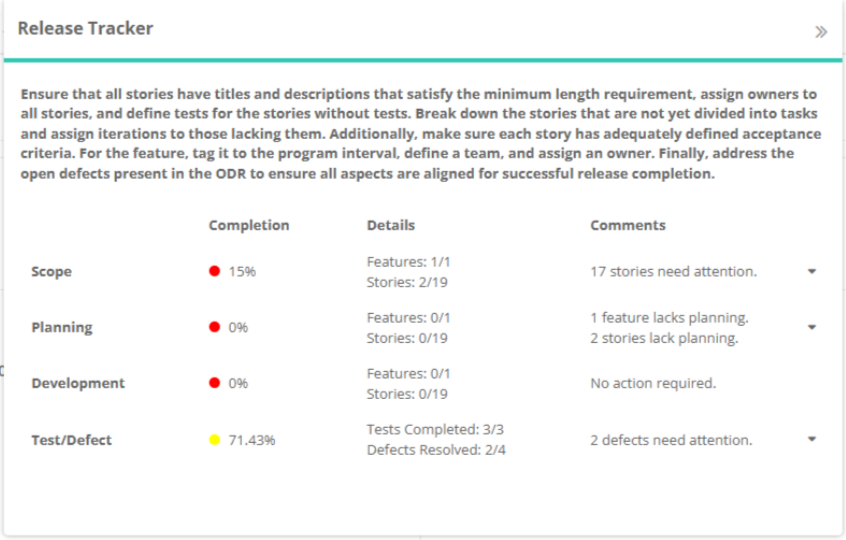
Risk Tagging to Capability
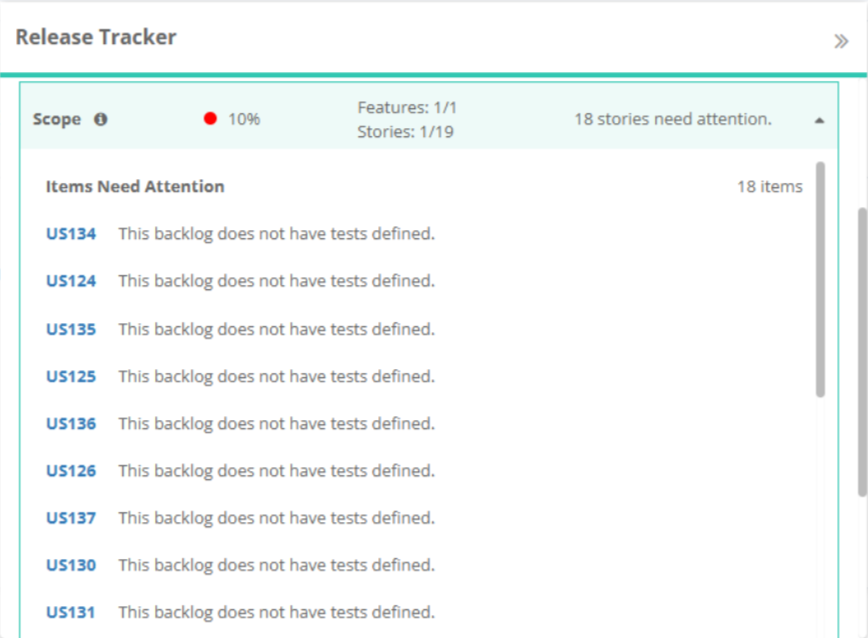
More Power to the Centralized Review Teams
Audit History for Approvals
Using Preferred Terminology for Approval
Including Approval Entity under DIY Reports
Flexible, Framework-Agnostic Workspace Creation
Follow these steps to view the changes